(All information courtesy of the instrument teams.)
![]() Previous IAU Circulars
Previous IAU Circulars
R.A.(2000)= 277.507
DEC.(2000)= 55.307
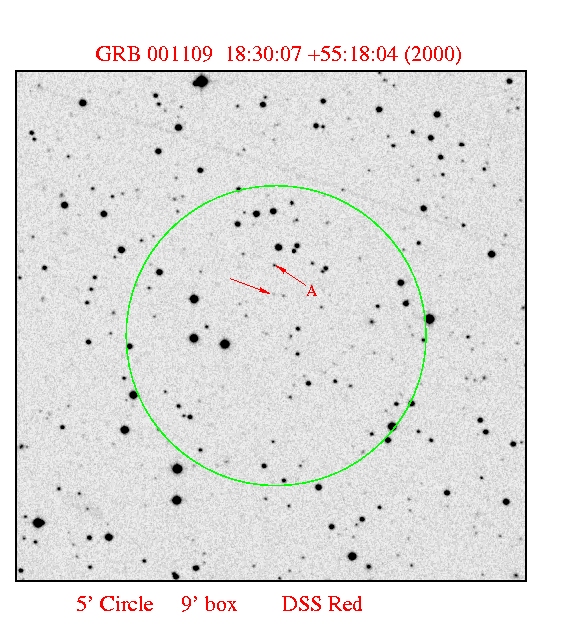
The error radius at this stage of analysis is 4'.
R.A.(2000)= 277.531
DEC.(2000)= +55.301
The error radius is 2.5'.

RA = 277.525
Delta = 55.309
The error radius is 1.5 arcminutes.
         UT date   filter  exptime   lim. mag.  radio source
 -----------------------------------------------------------
 2000 Nov.  9.81     J       300s      21.3	18.64 (0.05)
	    9.80     H       750s      21.0	17.96 (0.03)
	    9.79     Ks      750s      19.9	16.96 (0.04)

	   11.86     J       600s      21.4	18.70 (0.05)
	   11.82     H       600s      20.7	17.93 (0.08)
	   11.83     Ks      600s      19.4	17.07 (0.07)
Furthermore, after close inspection of the images by eye and by
comparing the aperture magnitudes of all the detectable objects
between the two epochs, we do not find an afterglow candidate. GRB magnitude hrs. since burst reference -------------------------------------------------------------------- 971214 J=20.3 11 [6] 980329 J~19.2 16 [7] 980703 H=17.6 30 [8] 990123 K=18.3 29 [9] 990510 J=17.1, H=16.4, K=16.6 14 [10] 990705 H=16.6 7 [11] 991216 J=16.8, K=15 13 [12] H=17.2 35 [13] 000214 K>18.2 32 [14] 000301C K~17.4 50 [15] 000418 K~17.5 60 [16] 000516 J>20.5, K>17.5 17 [17] 000615 H>20.5 17 [18] 000926 K~19 72 [19]Finally, we estimate a rough optical upper limit by extrapolating our H band upper limit to the R band, assuming a typical unreddened afterglow spectrum with a slope of -0.8, obtaining R > 23.1. Extinction intrinsic to the burster host galaxy is not included, which can substantially increase this R band limit.
1. Piro, L. et al. 2000, GCN No. 879
2. Amati, L. et al. 2000, IAU Circ. 7519
3.
http://www.jach.hawaii.edu/JACpublic/UKIRT/astronomy/calib/fs_newJHK.html
4. Taylor, G.B. et al. 2000, GCN No. 880
5. Stanek, K.Z. et al. 2000, GCN No. 881
6. Tanvir, N. et al. 1997, IAU Circ. 6796
7. Mannucci, F. et al. 1998, GCN No. 46
8. Vreeswijk, P. et al. 1999, ApJ, 523, 171
9. Bloom, J.S. et al. 1999, GCN No. 240
10. Rol, E. et al. 2001, in prep.
11. Masetti, N. et al. 2000, A&A, 354, 473
12. Garnavich, P. et al. 2000, ApJ, 543, 61
13. Rol, E. et al. 2001, in prep.
14. Rhoads, J. et al. 2000, GCN No. 564
15. Klose, S. et al. 2000, GCN No. 572
16. Stecklum, B. et al. 2000, GCN No. 654
17. Antonelli, A. et al. 2000, GCN No. 708
18. Palazzi, E. et al. 2000, GCN No. 727
19. Kobayashi, N. et al. 2000, GCN No. 821
--------------------------------------------------------------------
   Date (UT)      Telescope    filter  exposure    seeing   limiting
   (Start)                              (sec)     (arcsec)    mag.
--------------------------------------------------------------------
  Nov. 09.7712    CAHA 1.23      R      7 * 500      1.0     20.9
  Nov. 09.7846    CAHA 1.23      B      3 * 600      1.0     19.8
  Nov. 10.0980    NOFS 1.0       I       1800        1.9     21.0
  Nov. 10.7623    CAHA 1.23      R      9 * 500      1.0     20.9
  Nov. 10.8379    CAHA 3.5       H     10 * 300      1.5     20.5
  Nov. 13.0664    NOFS 1.0       I       1800        2.6     21.0
--------------------------------------------------------------------
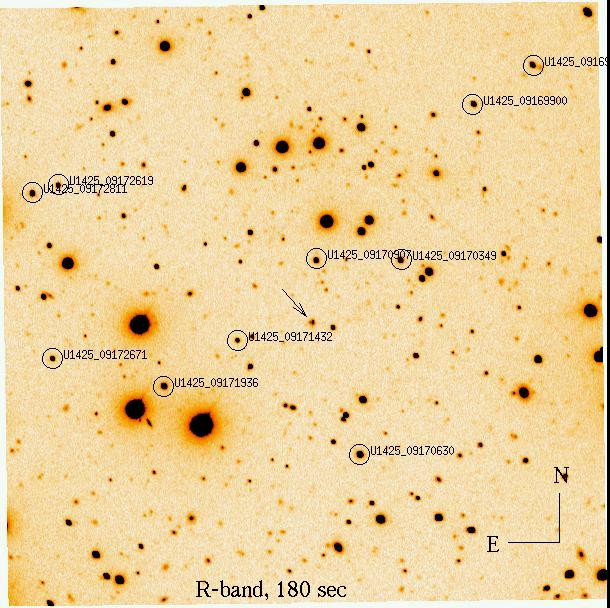
Photometric calibration of the images was done based on USNO magnitudes in the B and R band, and with selected area SA 113 for the I band. A comparison of the two epochs of (summed) R-band and I-band images, respectively, reveals no fading object in the GRB error box down to the limiting magnitudes as given in the table. The summed B band image does not contain any source which is not visible on the blue DSS-2. The H band image, when compared to the H band images of Vreeswijk et al. (GCN #886) also shows no fading object in the GRB error box.

