
Gamma-ray Burst 970828

The RXTE All Sky Monitor has detected the gamma ray burst reported as
BATSE trigger #6350 (burst at 1997 August 28, 17:44:36.8 UT). The
burst was detected by ASM camera #1 with a mean flux of 756 mCrab
(2-12 Kev) averaged over the 40 s in which the burst was seen before
the camera was rotated. Ninety seconds later, ASM camera #2 scanned
over the source and determined a crossing line of position and an
average flux of 238 mCrab, declining in an exponential-like fashion
with a 30 s time constant. The X-ray emission began roughly
simultaneously with the gamma ray trigger, but was detectable with the
ASM over at least 160 s. The combined camera detections yield an
X-ray position (J2000) of 18h 08m 29s +59 18' with uncertainty
(1 sigma) of +/- 2.5' in RA. and +- 1' in Dec. (courtesy R. Remillard,
A. Wood, D. Smith, and A. Levine (MIT)).
 Previous IAU Circulars
- IAUC
6726 Location with ASM/RXTE
- IAUC
6727 Detection and flux from PCA/RXTE scanning
- IAUC
6728 Refinded ASM error box and Ulysses/BATSE triangulation
- IAUC
6729 no optical variable down to POSS level; ASCA source
- IAUC
6730 no optical variations of >0.3 mag brighter than 22.5; radio source
with possible variability; optical object at radio position
- IAUC
6731 no optical variations of >0.5 mag brighter than POSSII on
Kiso Schmidt plates during Aug. 29.46-29.52 and 30.45-30.63 UT
- IAUC
6732 revised ASCA position and flux; X-ray source fades within observation
at t^-1.4
- IAUC
6733 no optical variations of >0.2 mag brighter than R=21 on Aug. 29.86,
30.84, and 31.83 UT
- IAUC
6735 no optical variations of >0.2 mag/day at R<24.5 on Aug. 30, 31, and
Sept. 1.
- IAUC
6756 survey down to K' = 20 mag; one object with large R-K' colour
- IAUC
6757 ROSAT location of X-ray afterglow; no optical variable within 10"
error box down to 25th mag
 Results of Observations
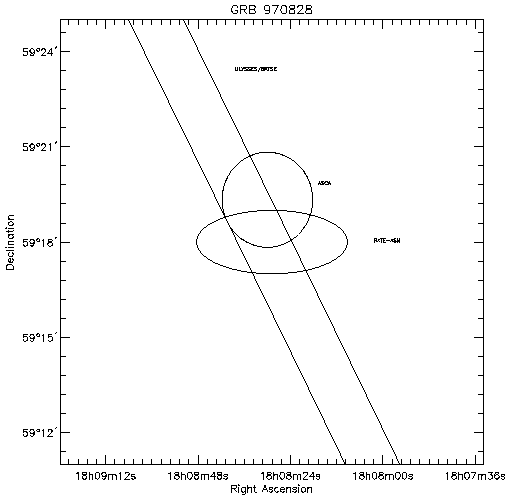
- The RXTE/ASM scanning observations have reduced the GRB error box
to about 5'*2' arcmin: The error box is an ellipse within a rhombus with
the following corners:
R.A. = 271.92, Decl. = +59.30; 272.10, +59.321;
272.31, +59.297; 272.14, +59.279 (equinox 2000.0).
- Scetch of the refined ASM error box with the IPN arc overlayed (courtesy
Don Smith)
- A radio source (IAUC 6730) is detected at R.A. = 18h08m25s.51 +/- 0s.05,
Decl. = +59o18'08".5" +/- 0".4 (equinox 2000.0) at a mean flux of
0.36 and 0.27 mJy on Aug. 31.19 and Sept. 1.27 UT (upper limit of
0.18 mJy on Aug. 28.88).
- An object with R = 24.5 +/- 0.5 (IAUC 6730) is detected at the position
of the radio source.
- A short
summary report on optical follow-up observations led by H. Pedersen
updated on Oct. 22, 1997;
V and R images
available
- I and K band
images
(from Klose, Eislöffel, and Stecklum; IAUC 6756):
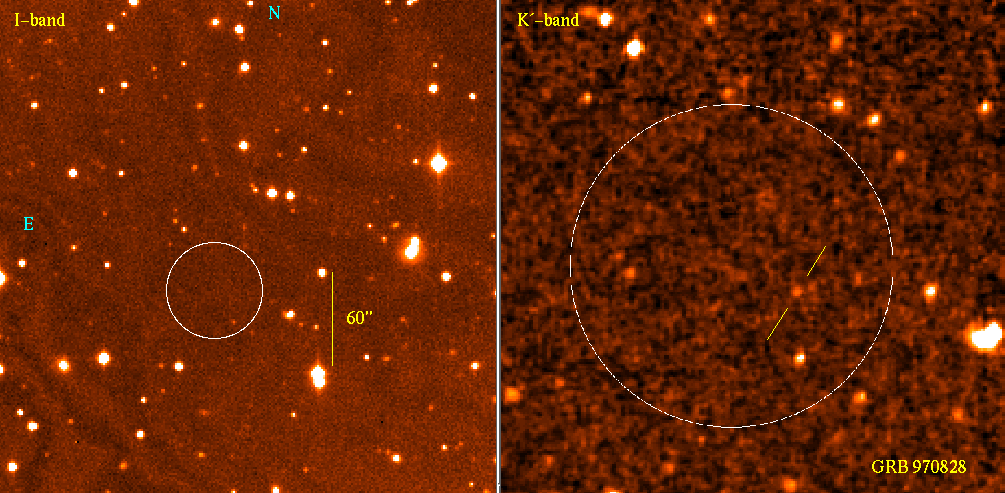
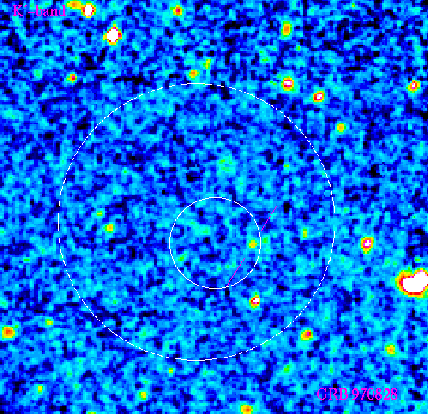
Left: I-band image taken on 1997, Aug. 31.9 UT using the
prime focus CCD
camera on the 1.34-m Schmidt telescope of the Thüringer Landessternwarte
Tautenburg (limiting magnitude about I = 20). Note that the I-band image
is slightly affected by a bad sky flat. Right: K'-band image
taken on Sept. 9.8 UT, Calar Alto Observatory,
Spain, using the 3.5-m telescope equipped with the MAGIC near-infrared camera
(wide-field mode, 0.81" pixels). The circle approximately represents the ASCA
error circle (radius 30 arcsec) reported by Murakami et al. (IAUC 6732). The
object mentioned in IAUC 6756 is indicated.
The K'-band image was reduced using a special sampling
technique, resulting in a pixel scale of 0.4" per pixel.
- HRI image of the ROSAT observation:
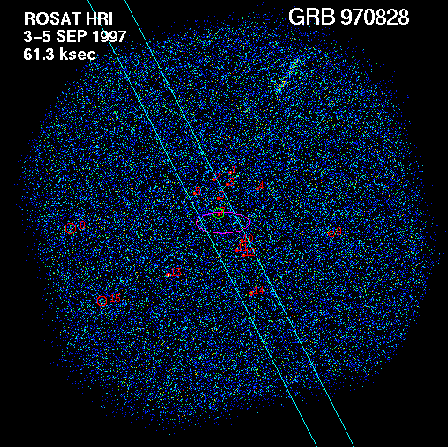
The ellipse represents the RXTE error box, the blue straight lines the IPN
triangulation arc and the green circle the ASCA position. ROSAT sources
are encircled (red) and numbered.
In the following two images the ROSAT position is plotted over:
Left: R band image taken at the 4.2m WHT about 3.5 hrs after the GRB.
The limiting magnitude is about 23.5 mag. The large circle is the ASCA
position (30" radius) and the small circle is the 10" ROSAT position.
Right: The K band image from Klose et al. (IAUC 6756)
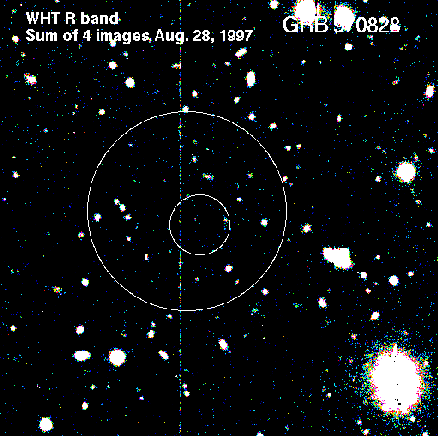
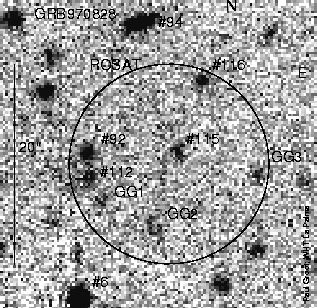
And finally a close-up view of the optical content in stacked WHT images
(from Aug. 28, 29 and Sep. 3, 4, 5). Note that East is to the right!
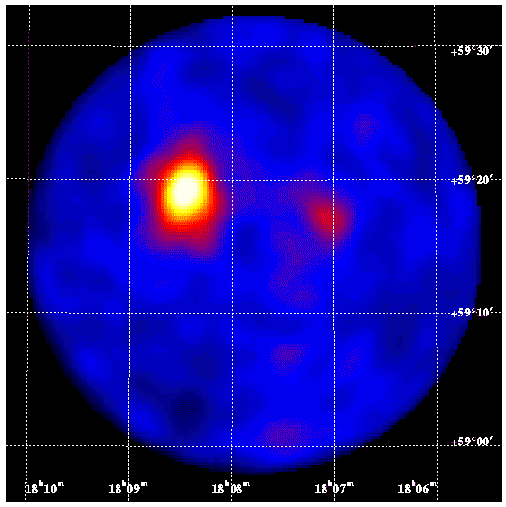
- X-ray images from
ASCA .
The whole time image is reproduced below:
- Note that there are two different redshift estimates on the 'market':
(1) z=0.33 from the X-ray spectrum (ASCA paper)
(2) z=0.958 from host galaxy; see
http://online.itp.ucsb.edu/online/gamma_c99/djorgovski/oh/01.html
- A reanalysis of the ASCA spectrum leads to a new interpretation
of the X-ray spectral feature as being radiative recombination edge + continuum
(Yoshida et al 2001, ApJ Lett.; astro-ph/0107331 + astro-ph/0107330 ).
Thus, the earlier redshift estimate of z=0.33 has been withdrawn.
- from Djorgovski et al. (astro-ph/0107539)
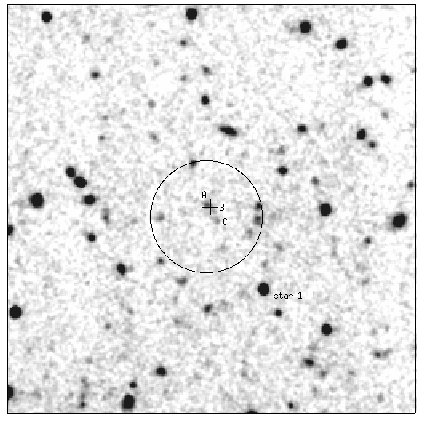 Image of the field of GRB 970828 from the R band data taken
at the Palomar 200-inch telescope on 1997 August 30 UT.
The field size shown is 72.5 arcsec square, with North up and
East to the left. The ROSAT error circle of the X-ray afterglow, with
a 10 arcsec radius is shown. The position of the radio afterglow is
indicated by the cross. Proposed host galaxy components (A, B, C) are
indicated. The offsets from star 1 to the brighter component of the
host galaxy component A are: 10.1 arcsec E, and 14.9 arcsec N.
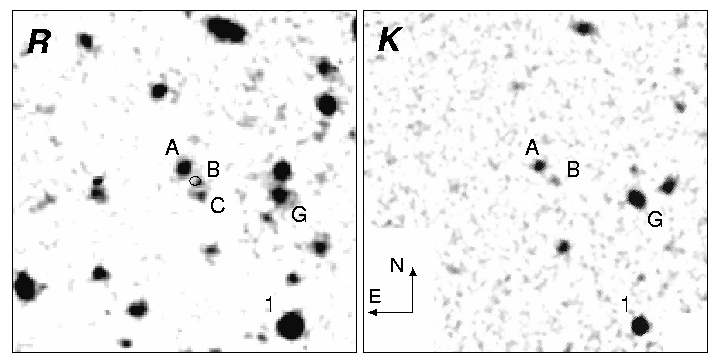 Close-up region of GRB 970828 in the R band (left) and K_s band
(right). The images are 33 x 33 arcsec^2 with North up and East
to the left. Galaxies A, B, and C are labeled as well
as the offset star 1. The small ellipse at the center of the R band
image is the 1-sigma error contour of the position of the radio
transient. The transient appears nearly coincident with galaxy B but may
also have arisen in the region between galaxies A and B, potentially a
dust lane intersecting a single, larger galaxy or a merging system of
with components A, B, and possibly C.
A comparison of the R and K images demonstrates the red colors of
galaxies A and B; in contrast, galaxy C appears to be very blue.
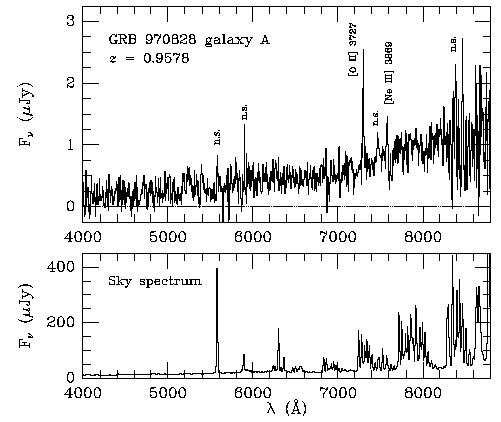 A weighted average spectrum of the component A of the host galaxy of GRB 970828
obtained at the Keck. Prominent emission lines of [O II] 3727 and [Ne III]
3869 are indicated; the remaining apparent features are artifacts of night
sky subtraction, with the sky spectrum shown in the bottom panel for
comparison. In addition to the emission lines, the spectrum also shows
the Balmer break at the same redshift, z = 0.9578.
- GCN notice #1134
GRB 970828: HST Observations of the Host Galaxy
J. S. Bloom, S. R. Kulkarni, T. J. Galama, D. A. Frail and S. G.
Djorgovski report on behalf the larger Caltech-NRAO-CARA GRB
Collaboration:
"We observed the field of GRB 970828 (Remillard et al., IAUC 6726;
Murakami et al., IAUC 6732; Groot et al. 1998, ApJ, 493, 27) on 2001
August 16-18 UT using the WFPC F450W, F606W, F814W filters on the Hubble
Space Telescope. The total integration time in each filter was 8800 s.
The 3-component host system seen in deep Keck imaging (Djorgovski et al.
2001, astro-ph/0107539, accepted) appears to be spatially resolved, with
no detected emission connecting the components. However, given the
signal-to-noise, we would be unable to detect low-surface brightness
features and cannot therefore make a strong claim about the geometry of
dust and stars in the system.
Astrometrically comparing the F606W images with the Keck localization, we
identify component "B" (from figure 3 of Djorgovski et al.) as the host
galaxy. The offset location and uncertainty (which is large due to the
poor astrometric tie between radio and optical images) are consistent with
those reported in Bloom, Kulkarni & Djorgovski (2001; astro-ph/0010176).
An image of the host may be found at:
http://www.astro.caltech.edu/~jsb/GRB/grb970828-host-reg.ps
The 3-sigma uncertainty contour of the OT position is shown in this
image as well as the galaxy component labels from Djorgovski et al."
This message may be cited.
- 1205.6651 from 31 May 12
L. Izzo et al.: On the thermal and double episode emissions in GRB 970828
Following the recent theoretical interpretation of GRB 090618 and GRB 101023, we here interpret GRB 970828 in terms of a double episode
emission: the first episode, observed in the first 40 s of the emission, is interpreted as the proto-black-hole emission; the second episode,
observed after t$_0$+50 s, as a canonical gamma ray burst. The transition between the two episodes marks the black hole formation. The
characteristics of the real GRB, in the second episode, are an energy of $E_{tot}^{e^+e^-} = 1.60 \times 10^{53}$ erg, a baryon load of $B = 7
\times 10^{-3}$ and a bulk Lorentz factor at transparency of $\Gamma = 142.5$. The clear analogy with GRB 090618 would require also in GRB
970828 the presence of a possible supernova. We also infer that the GRB exploded in an environment with a large average particle density $
\, \approx 10^3$ part/cm$^3$ and dense clouds characterized by typical dimensions of $(4 - 8) \times 10^{14}$ cm and $\delta n/n \propto 10$.
Such an environment is in line with the observed large column density absorption, which might have darkened both the supernova emission and the
GRB optical afterglow.
- 1311.7432 from 2 Dec 13
R. Ruffini et al.: Induced Gravitational Collapse in the BATSE era: the case of GRB 970828
Following the recently established "Induced Gravitational Collapse" (IGC) paradigm, we here interpret GRB 970828 in terms of the four episodes
typical of such a paradigm. The "Episode 1", up to 40 s after the trigger time t_0, with a time varying thermal emission and a total energy of
E_{iso,1st} = 2.60x10^{53} erg, is interpreted as due to the onset of a supernova Ib/c in a tight binary system with a companion neutron star.
The "Episode 2", observed up t_0+90 s, is interpreted as a canonical gamma ray burst, with an energy of E^{e^+e^-}_{tot} = 1.60x10^{53} erg, a
baryon load of B = 7x10^{-3} and a bulk Lorentz factor at transparency of \Gamma = 142.5. From this Episode 2, we infer that the GRB exploded
in an environment with a large average particle density ~ 10^3 particles/cm^3 and dense clouds characterized by typical dimensions of (4 -
8)x10^{14} cm and \delta n / n ~ 10. The "Episode 3" is identified from t_0+90 s all the way up to 10^{5-6} s: despite the paucity of the early
X-ray data, typical in the BATSE, pre-Swift era, we find extremely significant data points in the late X-ray afterglow emission of GRB 970828,
which corresponds to the ones observed in all IGC GRBs-SNe sources. The "Episode 4", related to the Supernova emission, does not appear to be
observable in this source, due to the presence of darkening from the large density of the GRB environment, also inferred from the analysis of
the Episode 2.
Back to JG's
homepage
Jochen Greiner, last update: 02-Dec-2013
[Disclaimer]
![]() Previous IAU Circulars
Previous IAU Circulars 


