Example Dysmalpy 1D fitting
In this example, we use dysmalpy to measure the kinematics of galaxy GS4_43501 at \(z=1.613\). This notebook shows how to find the best fit models for the one-dimensional velocity and velocity dispersion profiles (\(v(r)\) and \(\sigma(r)\)) using \(\texttt{MPFIT}\) as well as \(\texttt{MCMC}\). These fits allow us to measure quantities such as the total mass (disk+bulge), the effective radius \(r_\mathrm{eff}\), dark matter fraction \(f_\mathrm{DM}\) and velocity dispersion \(\sigma_0\).
The fitting includes the following components:
Disk + Bulge
NFW halo
Constant velocity dispersion
The structure of the notebook is the following:
Setup steps
Initialize galaxy, model set, instrument
MPFIT fitting
MCMC fitting
Visualize a real MCMC example
Nested sampling fitting
Visualize a real Nested Sampling example
1) Setup steps
Import modules
# Import modules
from __future__ import (absolute_import, division, print_function,
                        unicode_literals)
import dysmalpy
from dysmalpy import galaxy
from dysmalpy import models
from dysmalpy import fitting
from dysmalpy import instrument
from dysmalpy import data_classes
from dysmalpy import parameters
from dysmalpy import plotting
from dysmalpy import aperture_classes
from dysmalpy import observation
from dysmalpy import config

import os
import copy

import numpy as np
import astropy.units as u
import astropy.io.fits as fits
INFO:numexpr.utils:Note: NumExpr detected 10 cores but "NUMEXPR_MAX_THREADS" not set, so enforcing safe limit of 8.
INFO:numexpr.utils:NumExpr defaulting to 8 threads.
# A check for compatibility:
import emcee
if int(emcee.__version__[0]) >= 3:
    ftype_sampler = 'h5'
else:
    ftype_sampler = 'pickle'
Setup notebook
# Jupyter notebook setup
import matplotlib as mpl
import matplotlib.pyplot as plt
%matplotlib inline

mpl.rcParams['figure.dpi']= 100
mpl.rc("savefig", dpi=300)

from IPython.core.display import Image
# Check the location of the repository
dysmalpy.__path__
['/Users/jespejo/anaconda3/envs/test_dysmalpy/lib/python3.11/site-packages/dysmalpy']
Set data and output paths
# Data directory (datadir = /YOUR/DATA/PATH/)
filepath = os.path.abspath(fitting.__file__)
datadir = os.sep.join(os.path.dirname(filepath).split(os.sep)[:-1]+["tests", "test_data", ""])

# Where to save output files (output = /YOUR/OUTPUTS/PATH)
#outdir = '/Users/sedona/data/dysmalpy_test_examples/JUPYTER_OUTPUT_1D/'
outdir = '/Users/jespejo/Dropbox/Postdoc/Data/dysmalpy_test_examples/JUPYTER_OUTPUT_1D/'
Load the functions to tie parameters together
# Tie the z height to the effective radius
from dysmalpy.fitting_wrappers.tied_functions import tie_sigz_reff
# Tie the halo mass to the dark matter fraction
from dysmalpy.fitting_wrappers.tied_functions import tie_lmvirial_NFW
Info
Also see fitting_wrappers.tied_functions for more tied functions
2) Initialize galaxy, model set, instrument
gal = galaxy.Galaxy(z=1.613, name='GS4_43501')
mod_set = models.ModelSet()
Baryonic component: Combined Disk+Bulge
total_mass = 11.0    # M_sun
bt = 0.3             # Bulge-Total ratio
r_eff_disk = 5.0     # kpc
n_disk = 1.0
invq_disk = 5.0
r_eff_bulge = 1.0    # kpc
n_bulge = 4.0
invq_bulge = 1.0
noord_flat = True    # Switch for applying Noordermeer flattening

# Fix components
bary_fixed = {'total_mass': False,
              'r_eff_disk': False, #True,
              'n_disk': True,
              'r_eff_bulge': True,
              'n_bulge': True,
              'bt': True}

# Set bounds
bary_bounds = {'total_mass': (10, 13),
               'r_eff_disk': (1.0, 30.0),
               'n_disk': (1, 8),
               'r_eff_bulge': (1, 5),
               'n_bulge': (1, 8),
               'bt': (0, 1)}

bary = models.DiskBulge(total_mass=total_mass, bt=bt,
                        r_eff_disk=r_eff_disk, n_disk=n_disk,
                        invq_disk=invq_disk,
                        r_eff_bulge=r_eff_bulge, n_bulge=n_bulge,
                        invq_bulge=invq_bulge,
                        noord_flat=noord_flat,
                        name='disk+bulge',
                        fixed=bary_fixed, bounds=bary_bounds)

bary.r_eff_disk.prior = parameters.BoundedGaussianPrior(center=5.0, stddev=1.0)
Halo component
mvirial = 12.0
conc = 5.0
fdm = 0.5

halo_fixed = {'mvirial': False,
              'conc': True,
              'fdm':  False}
# Mvirial will be tied -- so must set 'fixed=False' for Mvirial...

halo_bounds = {'mvirial': (10, 13),
               'conc': (1, 20),
               'fdm': (0, 1)}

halo = models.NFW(mvirial=mvirial, conc=conc, fdm=fdm, z=gal.z,
                  fixed=halo_fixed, bounds=halo_bounds, name='halo')


halo.mvirial.tied = tie_lmvirial_NFW
Dispersion profile
sigma0 = 39.   # km/s
disp_fixed = {'sigma0': False}
disp_bounds = {'sigma0': (5, 300)}

disp_prof = models.DispersionConst(sigma0=sigma0, fixed=disp_fixed,
                                          bounds=disp_bounds, name='dispprof', tracer='halpha')
z-height profile
sigmaz = 0.9   # kpc
zheight_fixed = {'sigmaz': False}

zheight_prof = models.ZHeightGauss(sigmaz=sigmaz, name='zheightgaus',
                                   fixed=zheight_fixed)
zheight_prof.sigmaz.tied = tie_sigz_reff
Geometry
inc = 62.     # degrees
pa = 142.     # degrees, blue-shifted side CCW from north
xshift = 0    # pixels from center
yshift = 0    # pixels from center

geom_fixed = {'inc': True,
              'pa': True,
              'xshift': True,
              'yshift': True}

geom_bounds = {'inc': (0, 90),
               'pa': (90, 180),
               'xshift': (0, 4),
               'yshift': (-10, -4)}

geom = models.Geometry(inc=inc, pa=pa, xshift=xshift, yshift=yshift,
                       fixed=geom_fixed, bounds=geom_bounds,
                       name='geom', obs_name='halpha_1D')
Add all model components to ModelSet
# Add all of the model components to the ModelSet
mod_set.add_component(bary, light=True)
mod_set.add_component(halo)
mod_set.add_component(disp_prof)
mod_set.add_component(zheight_prof)
mod_set.add_component(geom)
Set kinematic options for calculating velocity profile
mod_set.kinematic_options.adiabatic_contract = False
mod_set.kinematic_options.pressure_support = True
Set up the observation and instrument
obs = observation.Observation(name='halpha_1D', tracer='halpha')
inst = instrument.Instrument()

beamsize = 0.55*u.arcsec                 # FWHM of beam
sig_inst = 45*u.km/u.s                   # Instrumental spectral resolution

beam = instrument.GaussianBeam(major=beamsize)
lsf = instrument.LSF(sig_inst)

inst.beam = beam
inst.lsf = lsf
inst.pixscale = 0.125*u.arcsec           # arcsec/pixel
inst.fov = [33, 33]                      # (nx, ny) pixels
inst.spec_type = 'velocity'              # 'velocity' or 'wavelength'
inst.spec_step = 10*u.km/u.s             # Spectral step
inst.spec_start = -1000*u.km/u.s         # Starting value of spectrum
inst.nspec = 201                         # Number of spectral pixels

# Extraction information
inst.ndim = 1                            # Dimensionality of data
inst.moment = False                      # For 1D/2D data, if True then velocities and dispersion calculated from moments
                                         # Default is False, meaning Gaussian extraction used

# Set the beam kernel so it doesn't have to be calculated every step
inst.set_beam_kernel()
inst.set_lsf_kernel()

# Add instrument to observation
obs.instrument = inst
Load data
Load the data from file:
1D velocity, dispersion profiles and error
A mask can be loaded / created as well
Put data in
Data1DclassAdd data to Galaxy object
f_data_1d = datadir+'GS4_43501.obs_prof.txt'
dat_arr = np.loadtxt(f_data_1d)
gs4_r = dat_arr[:,0]
gs4_vel = dat_arr[:,1]
gs4_disp = dat_arr[:,3]
err_vel = dat_arr[:,2]
err_disp = dat_arr[:,4]
inst_corr = True                  # Flag for if the measured dispersion has ALREADY
                                  # been corrected for instrumental resolution

# Put data in Data1D data class:
data1d = data_classes.Data1D(r=gs4_r, velocity=gs4_vel,
                                  vel_disp=gs4_disp, vel_err=err_vel,
                                  vel_disp_err=err_disp, inst_corr=inst_corr,
                                  filename_velocity=f_data_1d)

# Add data to Observation:
obs.data = data1d
Setup apertures:
# Setup apertures: circular apertures placed on the cube for GS4_43501.

profile1d_type = 'circ_ap_cube'    # Extraction in circular apertures placed on the cube

aperture_radius = 0.5 * obs.instrument.beam.major.value

obs.instrument.apertures = aperture_classes.setup_aperture_types(obs=obs,
                profile1d_type=profile1d_type,
                aper_centers=obs.data.rarr,
                slit_pa=pa, slit_width=beamsize.value,
                aperture_radius=aperture_radius,
                partial_weight=True)
Define model, fit options:
obs.mod_options.oversample = 1
# Factor by which to oversample model (eg, subpixels).
# For increased precision, oversample=3 is suggested.

obs.fit_options.fit = True             # Include this observation in the fit (T/F)
obs.fit_options.fit_velocity = True    # 1D/2D: Fit velocity of observation (T/F)
obs.fit_options.fit_dispersion = True  # 1D/2D: Fit dispersion of observation (T/F)
obs.fit_options.fit_flux = False       # 1D/2D: Fit flux of observation (T/F)
Add the model set, observation to the Galaxy
gal.model = mod_set
gal.add_observation(obs)
3) MPFIT Fitting
Set up MPFITFitter fitter with fitting parameters
# Options passed to MPFIT:
maxiter = 200

fitter = fitting.MPFITFitter(maxiter=maxiter)
Set up fit/plot output options
# Output directory
outdir_mpfit = outdir+'MPFIT/'

# Output options:
do_plotting = True
plot_type = 'png'
overwrite = True

output_options = config.OutputOptions(outdir=outdir_mpfit,
                                      do_plotting=do_plotting,
                                      plot_type=plot_type,
                                      overwrite=overwrite)
Run Dysmalpy fitting: MPFIT
mpfit_results = fitter.fit(gal, output_options)
INFO:DysmalPy:*************************************
INFO:DysmalPy: Fitting: GS4_43501 using MPFIT
INFO:DysmalPy:    obs: halpha_1D
INFO:DysmalPy:        velocity file: /Users/jespejo/anaconda3/envs/test_dysmalpy/lib/python3.11/site-packages/dysmalpy/tests/test_data/GS4_43501.obs_prof.txt
INFO:DysmalPy:        nSubpixels: 1
INFO:DysmalPy:    mvirial_tied: <function tie_lmvirial_NFW at 0x176d520c0>
INFO:DysmalPy:
MPFIT Fitting:
Start: 2024-05-02 10:49:19.586290

INFO:DysmalPy:Iter 1  CHI-SQUARE = 1334.862701  DOF = 32
   disk+bulge:total_mass = 11
   disk+bulge:r_eff_disk = 5
   halo:fdm = 0.5
   dispprof:sigma0 = 39

INFO:DysmalPy:Iter 2  CHI-SQUARE = 85.6231556  DOF = 32
   disk+bulge:total_mass = 10.77432295
   disk+bulge:r_eff_disk = 3.705314705
   halo:fdm = 0.3506872292
   dispprof:sigma0 = 44.07857595

INFO:DysmalPy:Iter 3  CHI-SQUARE = 61.77205264  DOF = 32
   disk+bulge:total_mass = 10.70608814
   disk+bulge:r_eff_disk = 3.205907928
   halo:fdm = 0.3052349661
   dispprof:sigma0 = 39.29020077

INFO:DysmalPy:Iter 4  CHI-SQUARE = 61.51072465  DOF = 32
   disk+bulge:total_mass = 10.7026735
   disk+bulge:r_eff_disk = 3.149004183
   halo:fdm = 0.2942521363
   dispprof:sigma0 = 38.49846585

INFO:DysmalPy:Iter 5  CHI-SQUARE = 61.50931018  DOF = 32
   disk+bulge:total_mass = 10.70194394
   disk+bulge:r_eff_disk = 3.135826616
   halo:fdm = 0.2929452012
   dispprof:sigma0 = 38.4178716

INFO:DysmalPy:Iter 6  CHI-SQUARE = 61.50910464  DOF = 32
   disk+bulge:total_mass = 10.70165471
   disk+bulge:r_eff_disk = 3.131424741
   halo:fdm = 0.2925721625
   dispprof:sigma0 = 38.39244171

INFO:DysmalPy:Iter 7  CHI-SQUARE = 61.50901234  DOF = 32
   disk+bulge:total_mass = 10.70142024
   disk+bulge:r_eff_disk = 3.128065533
   halo:fdm = 0.2923058891
   dispprof:sigma0 = 38.37326607

INFO:DysmalPy:Iter 8  CHI-SQUARE = 61.50900134  DOF = 32
   disk+bulge:total_mass = 10.70133658
   disk+bulge:r_eff_disk = 3.126817225
   halo:fdm = 0.2922023915
   dispprof:sigma0 = 38.36605847

INFO:DysmalPy:Iter 9  CHI-SQUARE = 61.5090004  DOF = 32
   disk+bulge:total_mass = 10.70131482
   disk+bulge:r_eff_disk = 3.126478596
   halo:fdm = 0.2921732623
   dispprof:sigma0 = 38.3641034

INFO:DysmalPy:Iter 10  CHI-SQUARE = 61.50900028  DOF = 32
   disk+bulge:total_mass = 10.70130665
   disk+bulge:r_eff_disk = 3.126355714
   halo:fdm = 0.2921630194
   dispprof:sigma0 = 38.3633983

INFO:DysmalPy:Iter 11  CHI-SQUARE = 61.50900026  DOF = 32
   disk+bulge:total_mass = 10.70130363
   disk+bulge:r_eff_disk = 3.126310618
   halo:fdm = 0.2921592812
   dispprof:sigma0 = 38.36313989

INFO:DysmalPy:
End: 2024-05-02 10:49:23.811334

******************
Time= 4.22 (sec),   0:4.22 (m:s)
MPFIT Status = 1
MPFIT Error/Warning Message = None
******************
Examine MPFIT results
Result plots
# Look at best-fit:
filepath = outdir_mpfit+"GS4_43501_mpfit_bestfit_halpha_1D.{}".format(plot_type)
Image(filename=filepath, width=600)

Directly generating result plots
Reload the galaxy, results files:
f_galmodel =       outdir_mpfit + 'GS4_43501_model.pickle'
f_mpfit_results =  outdir_mpfit + 'GS4_43501_mpfit_results.pickle'

gal, mpfit_results = fitting.reload_all_fitting(filename_galmodel=f_galmodel,
                            filename_results=f_mpfit_results, fit_method='mpfit')
Plot the best-fit results:
mpfit_results.plot_results(gal)
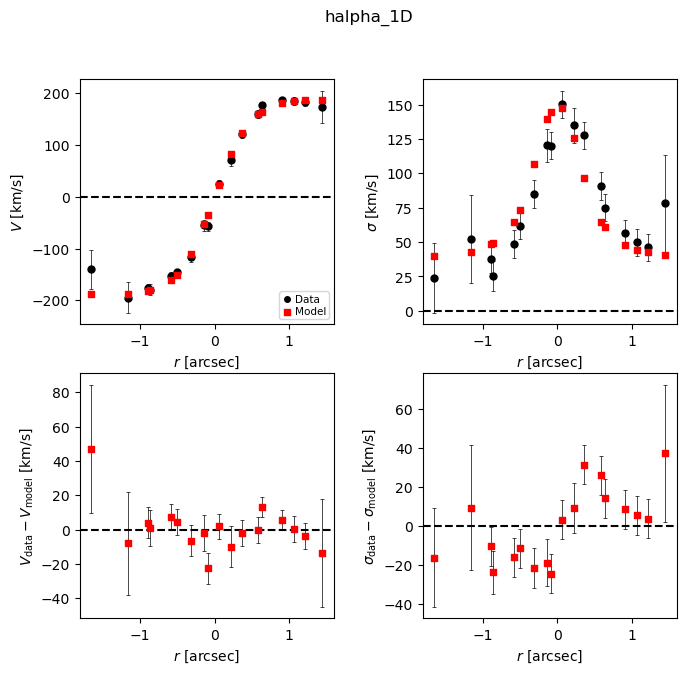
Result reports
We now look at the results reports, which include the best-fit values and uncertainties (as well as other fitting settings and output).
# Print report
print(mpfit_results.results_report(gal=gal))
###############################
 Fitting for GS4_43501

Date: 2024-05-02 10:49:24.705699

    obs: halpha_1D
         Datafiles:
             vel :  /Users/jespejo/anaconda3/envs/test_dysmalpy/lib/python3.11/site-packages/dysmalpy/tests/test_data/GS4_43501.obs_prof.txt
         apertures:        CircApertures
         fit_velocity:           True
         fit_dispersion:         True
         fit_flux:               False
         moment:           False
         partial_weight:        True
         n_wholepix_z_min:      3
         oversample:            1
         oversize:              1


Fitting method: MPFIT
    fit status: 1

pressure_support:      True
pressure_support_type: 1

###############################
 Fitting results
-----------
 disk+bulge
    total_mass         10.7013  +/-   0.0456
    r_eff_disk          3.1263  +/-   0.4107

    n_disk              1.0000  [FIXED]
    r_eff_bulge         1.0000  [FIXED]
    n_bulge             4.0000  [FIXED]
    bt                  0.3000  [FIXED]
    mass_to_light       1.0000  [FIXED]

    noord_flat          True
-----------
 halo
    fdm                 0.2922  +/-   0.0497

    mvirial            12.4479  [TIED]
    conc                5.0000  [FIXED]
-----------
 dispprof
    sigma0             38.3630  +/-   4.3444
-----------
 zheightgaus
    sigmaz              0.5310  [TIED]
-----------
 geom
    inc                62.0000  [FIXED]
    pa                142.0000  [FIXED]
    xshift              0.0000  [FIXED]
    yshift              0.0000  [FIXED]
    vel_shift           0.0000  [FIXED]

-----------
Adiabatic contraction: False

-----------
Red. chisq: 1.9222
To directly save the results report to a file, we can use the following:
(Note: by default, report files are saved as part of the fitting process)
# Save report to file:
f_mpfit_report = outdir_mpfit + 'mpfit_fit_report.txt'
mpfit_results.results_report(gal=gal, filename=f_mpfit_report)
4) MCMC Fitting
Get a clean copy of model
gal.model = copy.deepcopy(mod_set)
Set up MCMCFitter fitter with fitting parameters
# Options passed to emcee
## SHORT TEST:
nWalkers = 20
nCPUs = 4
scale_param_a = 5 #3
# The walkers were not exploring the parameter space well with scale_param_a = 3,
#     but were getting 'stuck'. So to improve the walker movement with larger
#     'stretch' in the steps, we increased scale_param_a.
nBurn = 2
nSteps = 10
minAF = None
maxAF = None
nEff = 10

blob_name = 'mvirial'    # Also save 'blob' values of Mvirial, calculated at every chain step


fitter = fitting.MCMCFitter(nWalkers=nWalkers, nCPUs=nCPUs,
                            scale_param_a=scale_param_a, nBurn=nBurn, nSteps=nSteps,
                            minAF=minAF, maxAF=maxAF, nEff=nEff, blob_name=blob_name)
Set up fit/plot output options
# Output directory
outdir_mcmc = outdir + 'MCMC/'

# Output options:
do_plotting = True
plot_type = 'png'
overwrite = True

output_options = config.OutputOptions(outdir=outdir_mcmc,
                                      do_plotting=do_plotting,
                                      plot_type=plot_type,
                                      overwrite=overwrite)
Run Dysmalpy fitting: MCMC
mcmc_results = fitter.fit(gal, output_options)
INFO:DysmalPy:*************************************
INFO:DysmalPy: Fitting: GS4_43501 with MCMC
INFO:DysmalPy:    obs: halpha_1D
INFO:DysmalPy:        velocity file: /Users/jespejo/anaconda3/envs/test_dysmalpy/lib/python3.11/site-packages/dysmalpy/tests/test_data/GS4_43501.obs_prof.txt
INFO:DysmalPy:        nSubpixels: 1
INFO:DysmalPy:
nCPUs: 4
INFO:DysmalPy:nWalkers: 20
INFO:DysmalPy:lnlike: oversampled_chisq=True
INFO:DysmalPy:
blobs: mvirial
INFO:DysmalPy:
mvirial_tied: <function tie_lmvirial_NFW at 0x176d520c0>
INFO:DysmalPy:
Burn-in:
Start: 2024-05-02 10:49:24.785057

INFO:DysmalPy: k=0, time.time=2024-05-02 10:49:24.785761, a_frac=nan
INFO:DysmalPy: k=1, time.time=2024-05-02 10:49:25.702812, a_frac=0.15
INFO:DysmalPy:
End: 2024-05-02 10:49:26.024287

******************
nCPU, nParam, nWalker, nBurn = 4, 4, 20, 2
Scale param a= 5
Time= 1.24 (sec),   0:1.24 (m:s)
Mean acceptance fraction: 0.175
Ideal acceptance frac: 0.2 - 0.5
Autocorr est: [nan nan nan nan]
******************
INFO:DysmalPy:
Ensemble sampling:
Start: 2024-05-02 10:49:26.323181

INFO:DysmalPy:ii=0, a_frac=0.0 time.time()=2024-05-02 10:49:26.654147
INFO:DysmalPy:0: acor_time =[nan nan nan nan]
INFO:DysmalPy:ii=1, a_frac=0.1 time.time()=2024-05-02 10:49:26.985441
INFO:DysmalPy:1: acor_time =[nan nan nan nan]
INFO:DysmalPy:ii=2, a_frac=0.08333333333333333 time.time()=2024-05-02 10:49:27.310019
INFO:DysmalPy:2: acor_time =[nan nan nan nan]
INFO:DysmalPy:ii=3, a_frac=0.0875 time.time()=2024-05-02 10:49:27.625109
INFO:DysmalPy:3: acor_time =[nan nan nan nan]
INFO:DysmalPy:ii=4, a_frac=0.1 time.time()=2024-05-02 10:49:27.966173
INFO:DysmalPy:4: acor_time =[nan nan nan nan]
INFO:DysmalPy:ii=5, a_frac=0.14166666666666666 time.time()=2024-05-02 10:49:28.306641
INFO:DysmalPy:5: acor_time =[nan nan nan nan]
INFO:DysmalPy:ii=6, a_frac=0.1571428571428571 time.time()=2024-05-02 10:49:28.640043
INFO:DysmalPy:6: acor_time =[nan nan nan nan]
INFO:DysmalPy:ii=7, a_frac=0.175 time.time()=2024-05-02 10:49:28.965469
INFO:DysmalPy:7: acor_time =[nan nan nan nan]
INFO:DysmalPy:ii=8, a_frac=0.17222222222222222 time.time()=2024-05-02 10:49:29.287314
INFO:DysmalPy:8: acor_time =[nan nan nan nan]
INFO:DysmalPy:ii=9, a_frac=0.18000000000000002 time.time()=2024-05-02 10:49:29.630192
INFO:DysmalPy:9: acor_time =[nan nan nan nan]
INFO:DysmalPy:Finished 10 steps

INFO:DysmalPy:
End: 2024-05-02 10:49:29.635079

******************
nCPU, nParam, nWalker, nSteps = 4, 4, 20, 10
Scale param a= 5
Time= 3.31 (sec),   0:3.31 (m:s)
Mean acceptance fraction: 0.180
Ideal acceptance frac: 0.2 - 0.5
Autocorr est: [nan nan nan nan]
******************
Examine MCMC results
Of course this (very short!) example looks terrible, but it’s instructive to see what’s happening even if you only did a very short / few walker MCMC test:
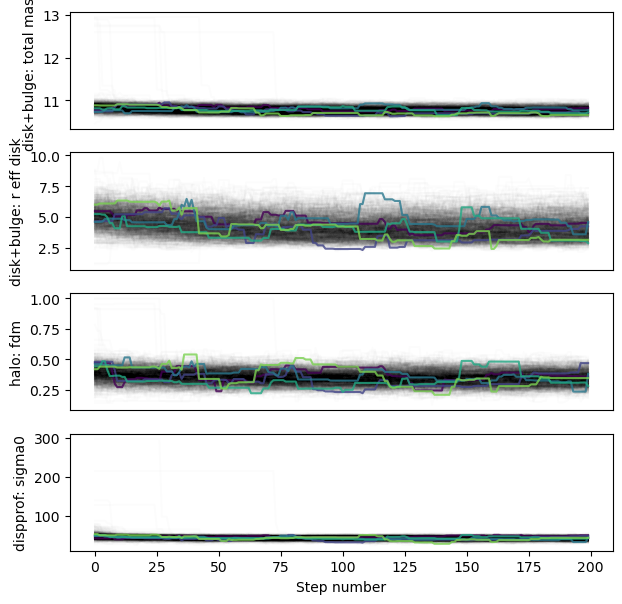
Trace
The individual walkers should move around in the parameter space over the chain iterations (not necessarily for every step; but there should be some exploration of the space)
# Look at trace:
filepath = outdir_mcmc+"GS4_43501_mcmc_trace.{}".format(plot_type)
Image(filepath, width=600)
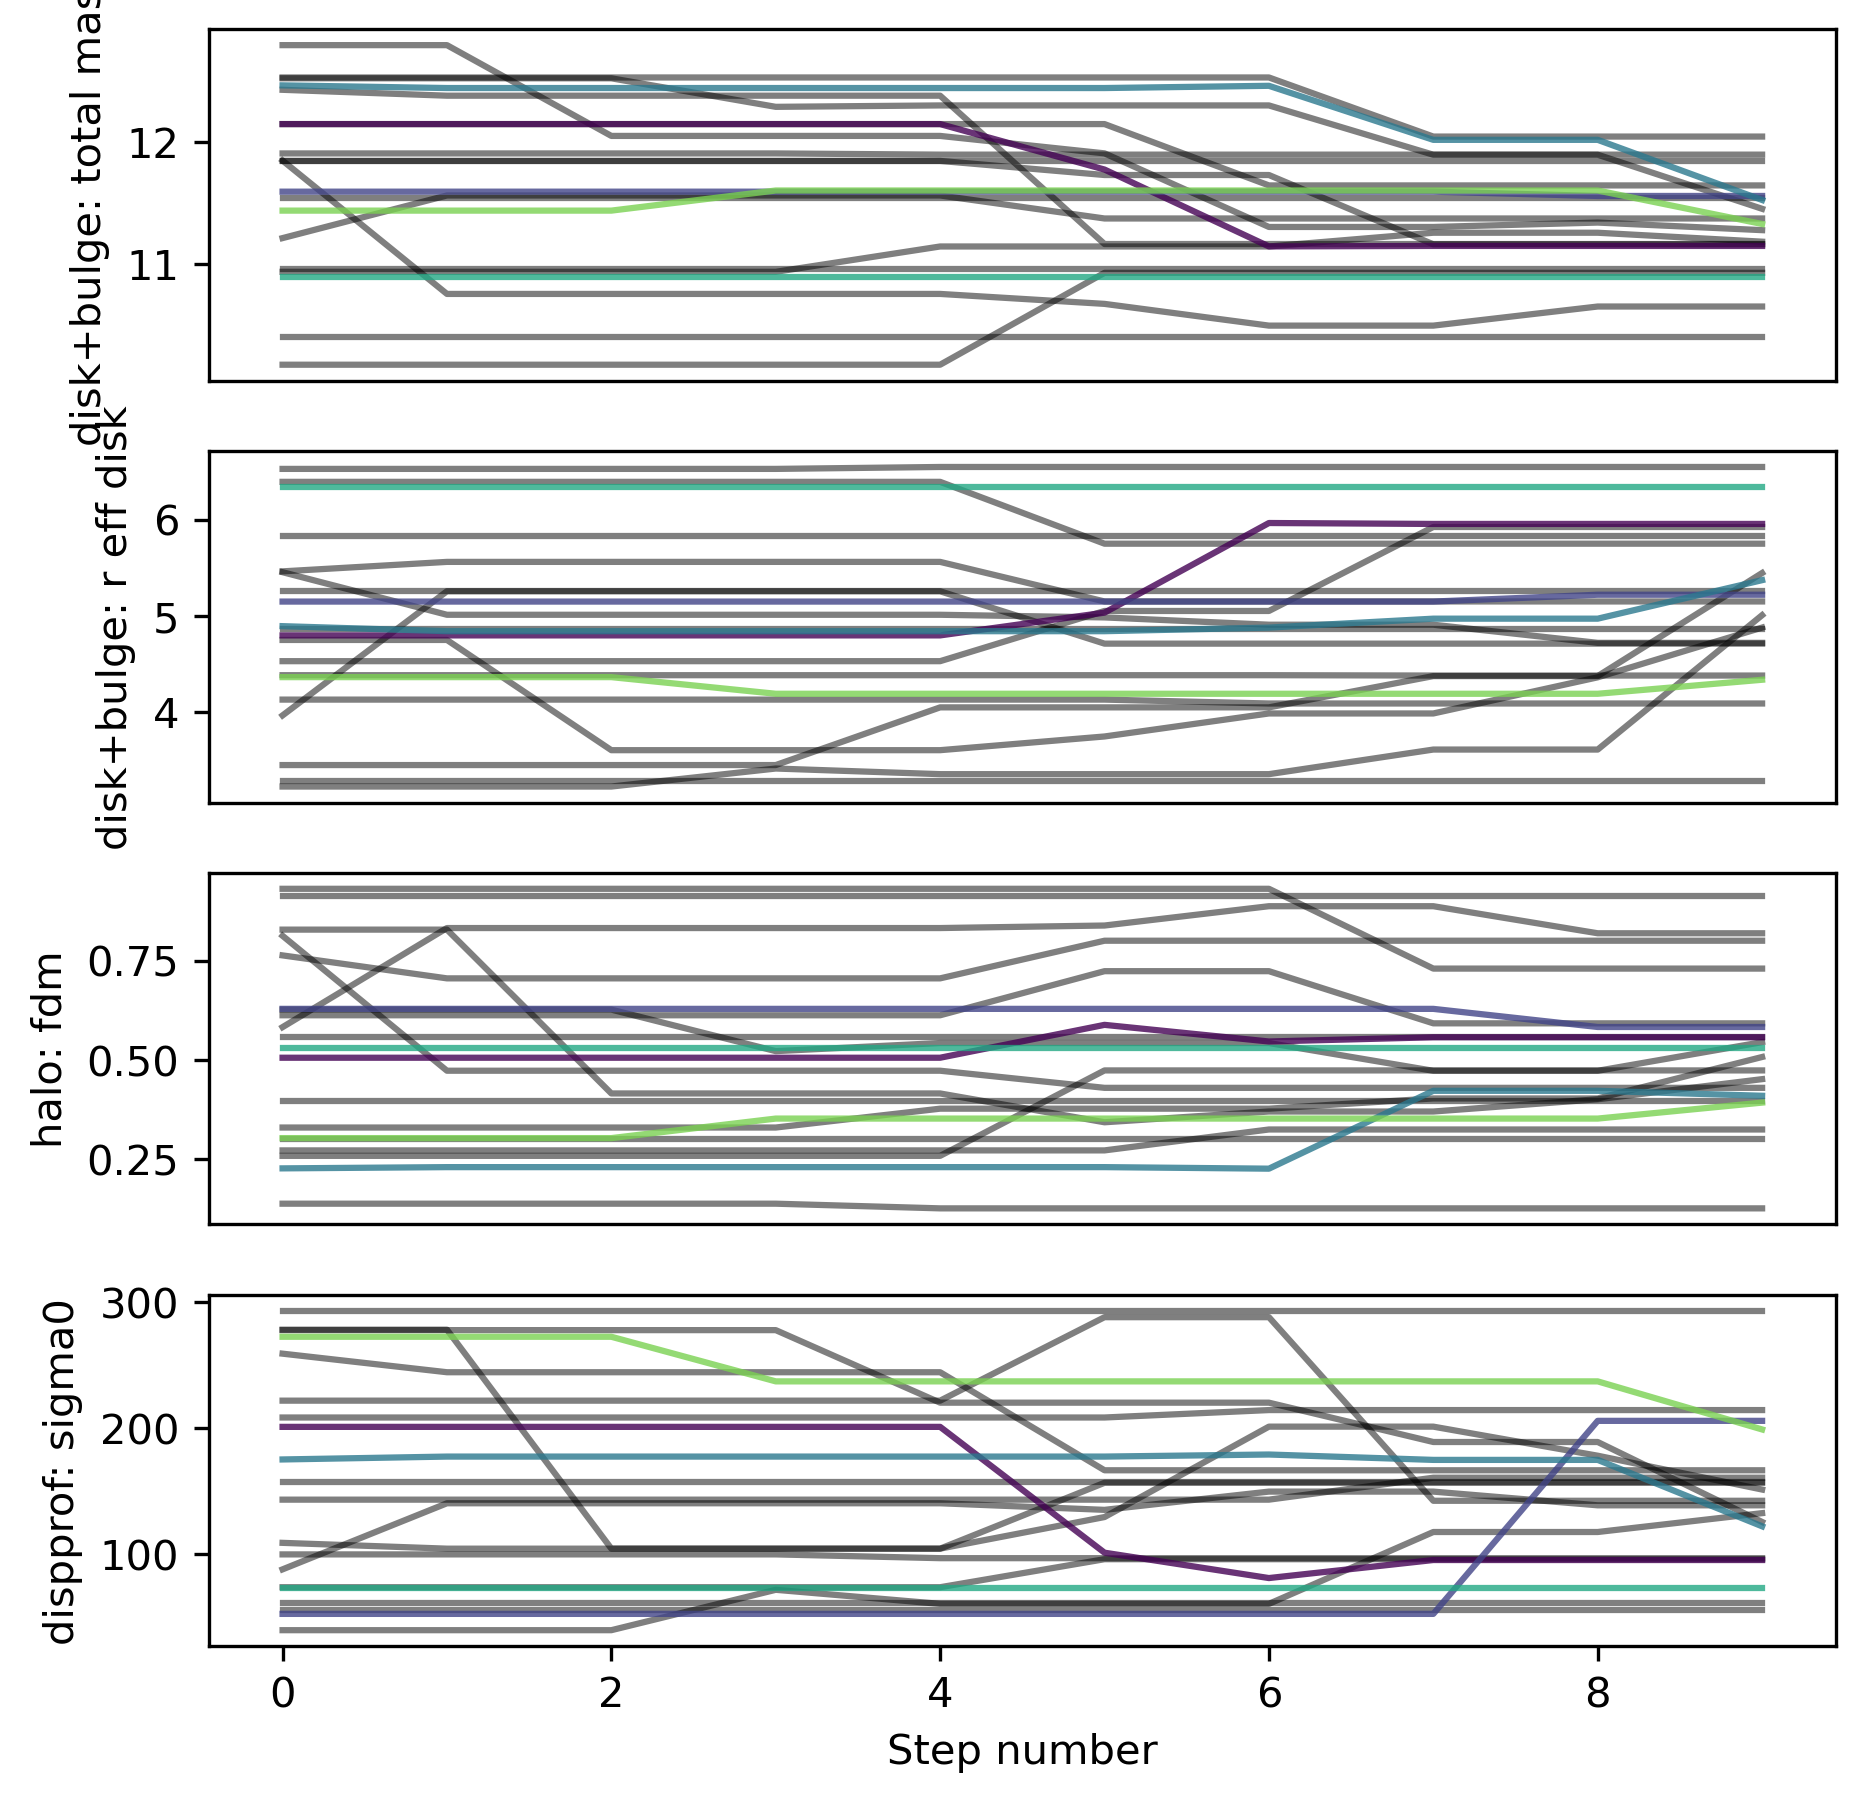
Best-fit
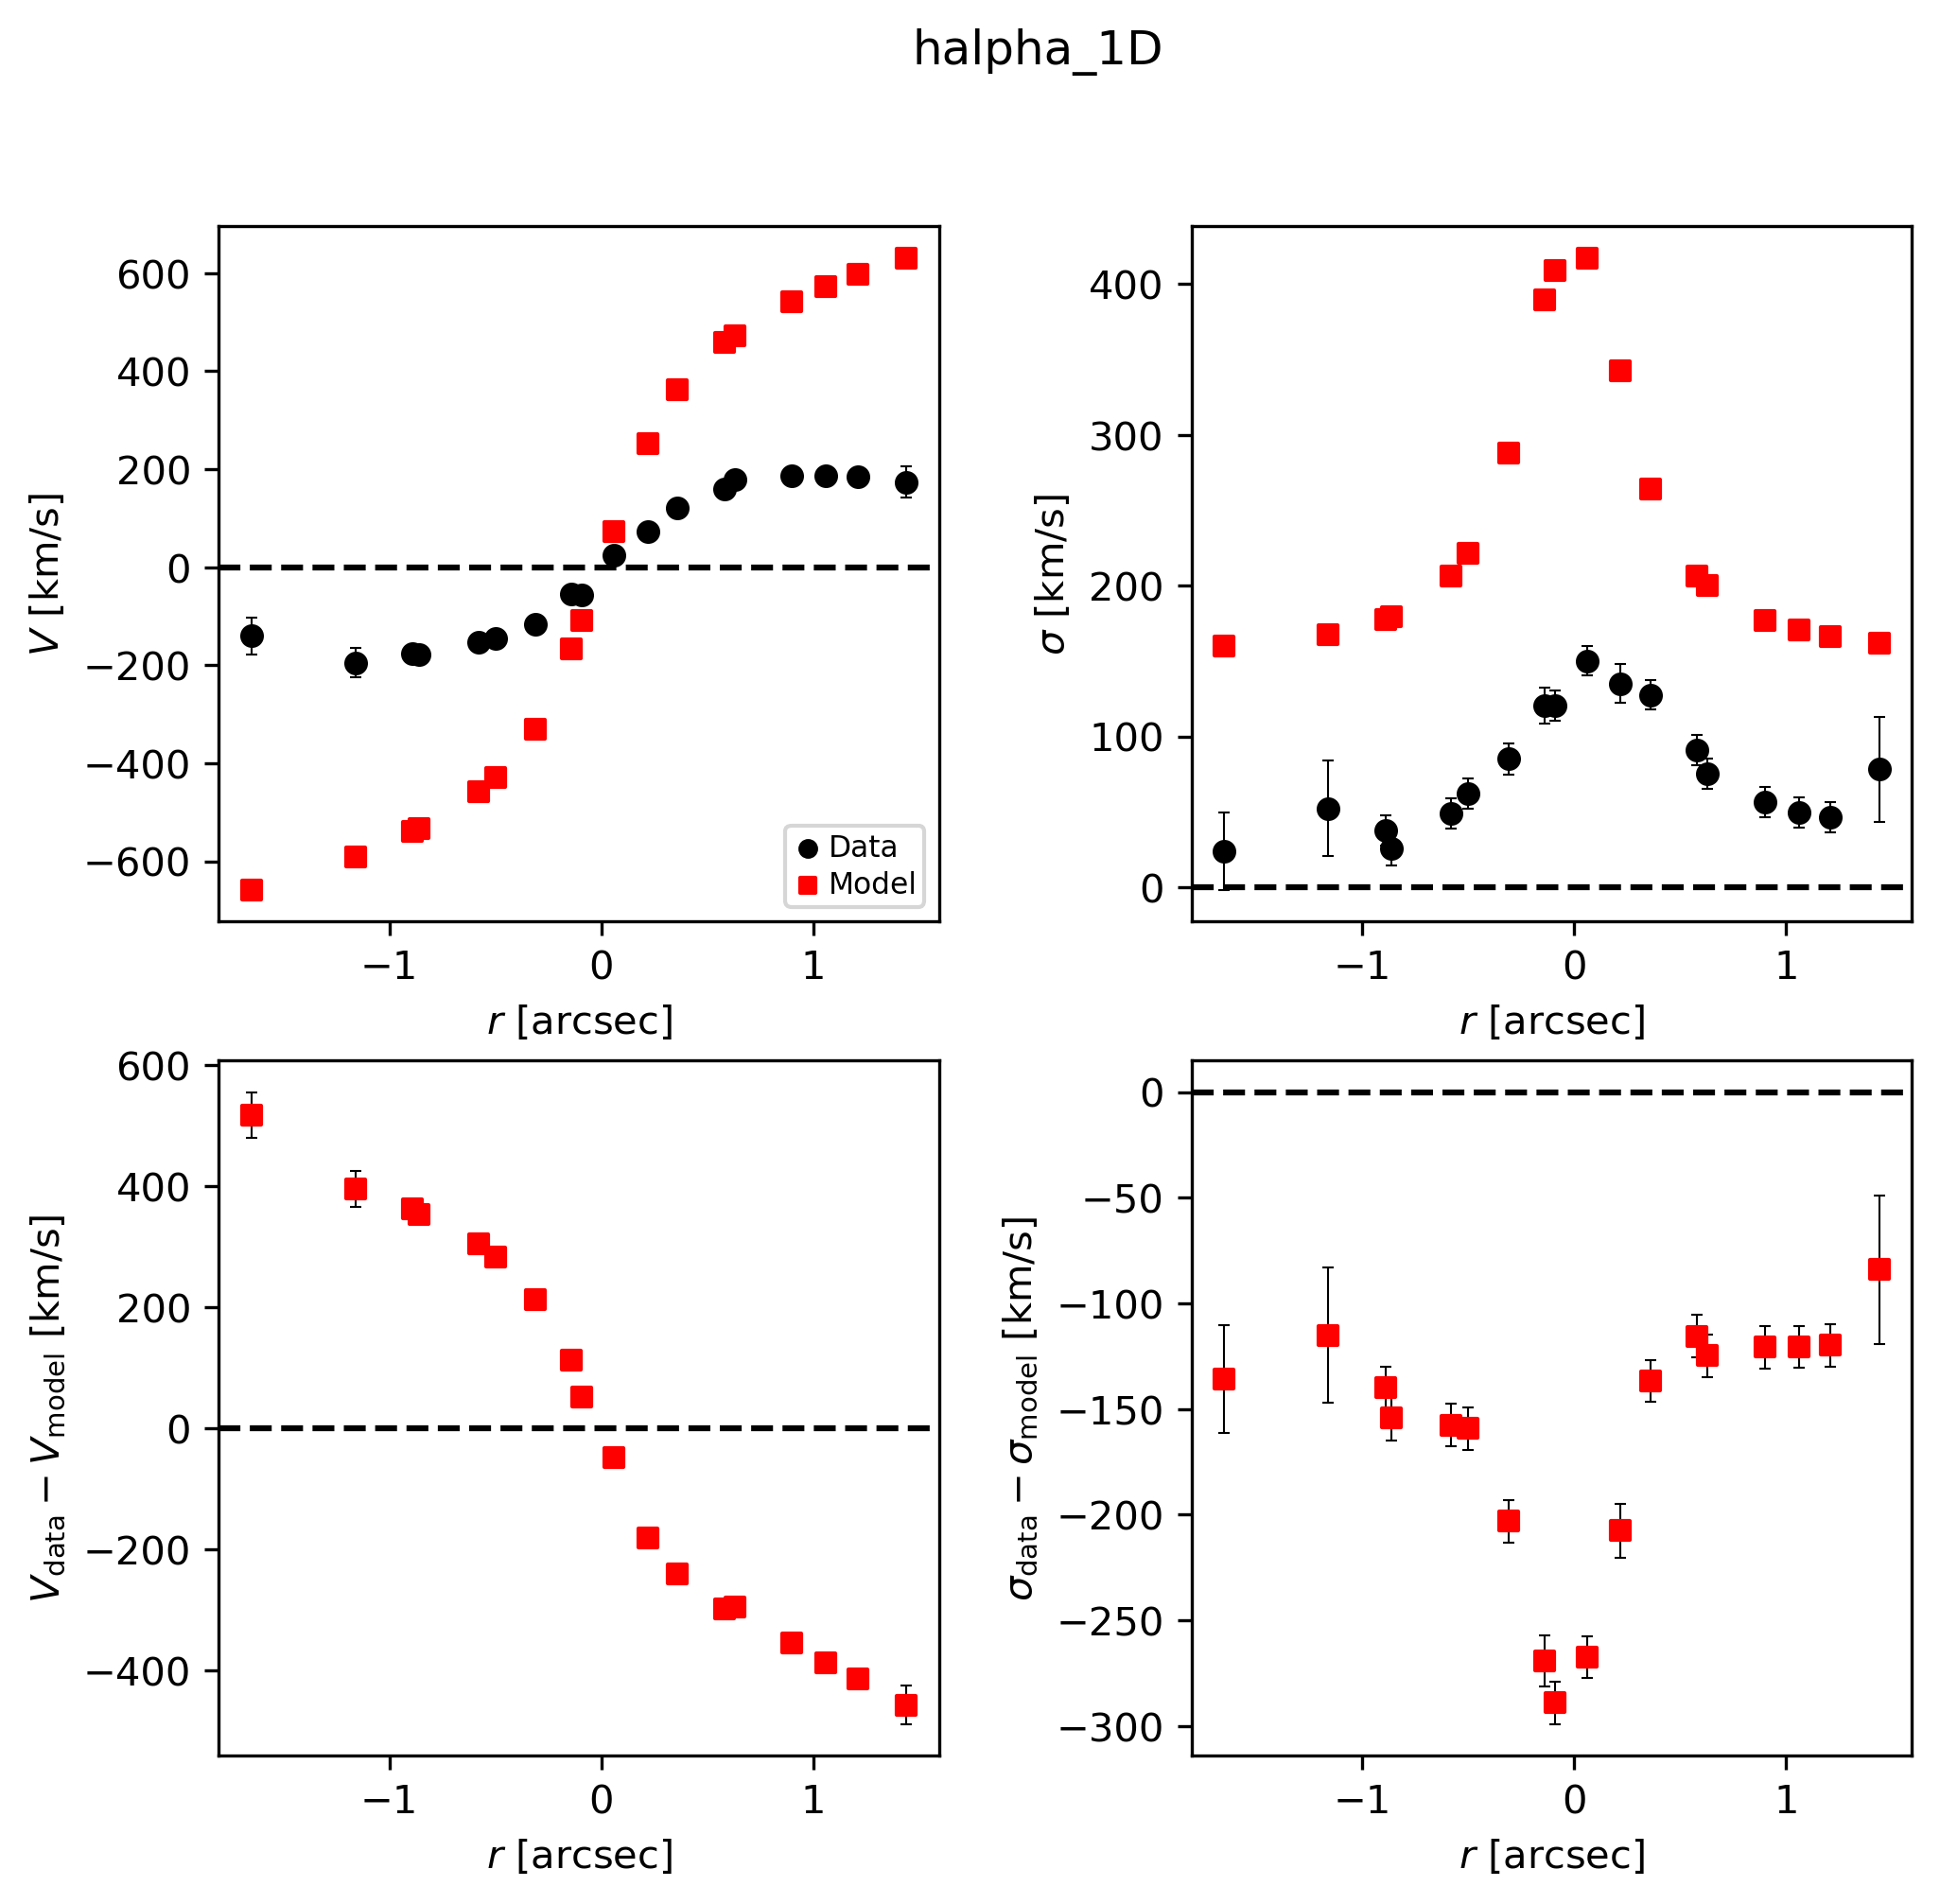
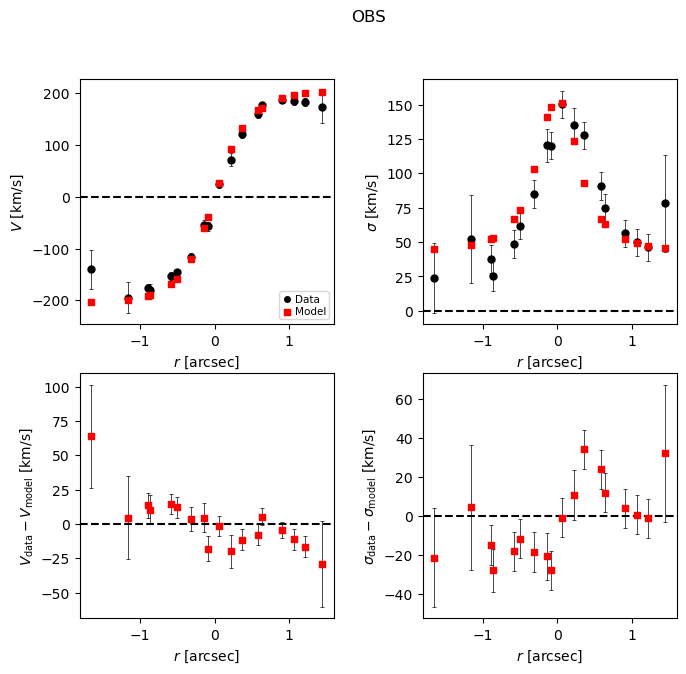
This is a good opportunity to check that the model PA and slit PA are correct, or else the data and model curves will have opposite shapes!
# Look at best-fit:
filepath = outdir_mcmc+"GS4_43501_mcmc_bestfit_halpha_1D.{}".format(plot_type)
Image(filepath, width=600)
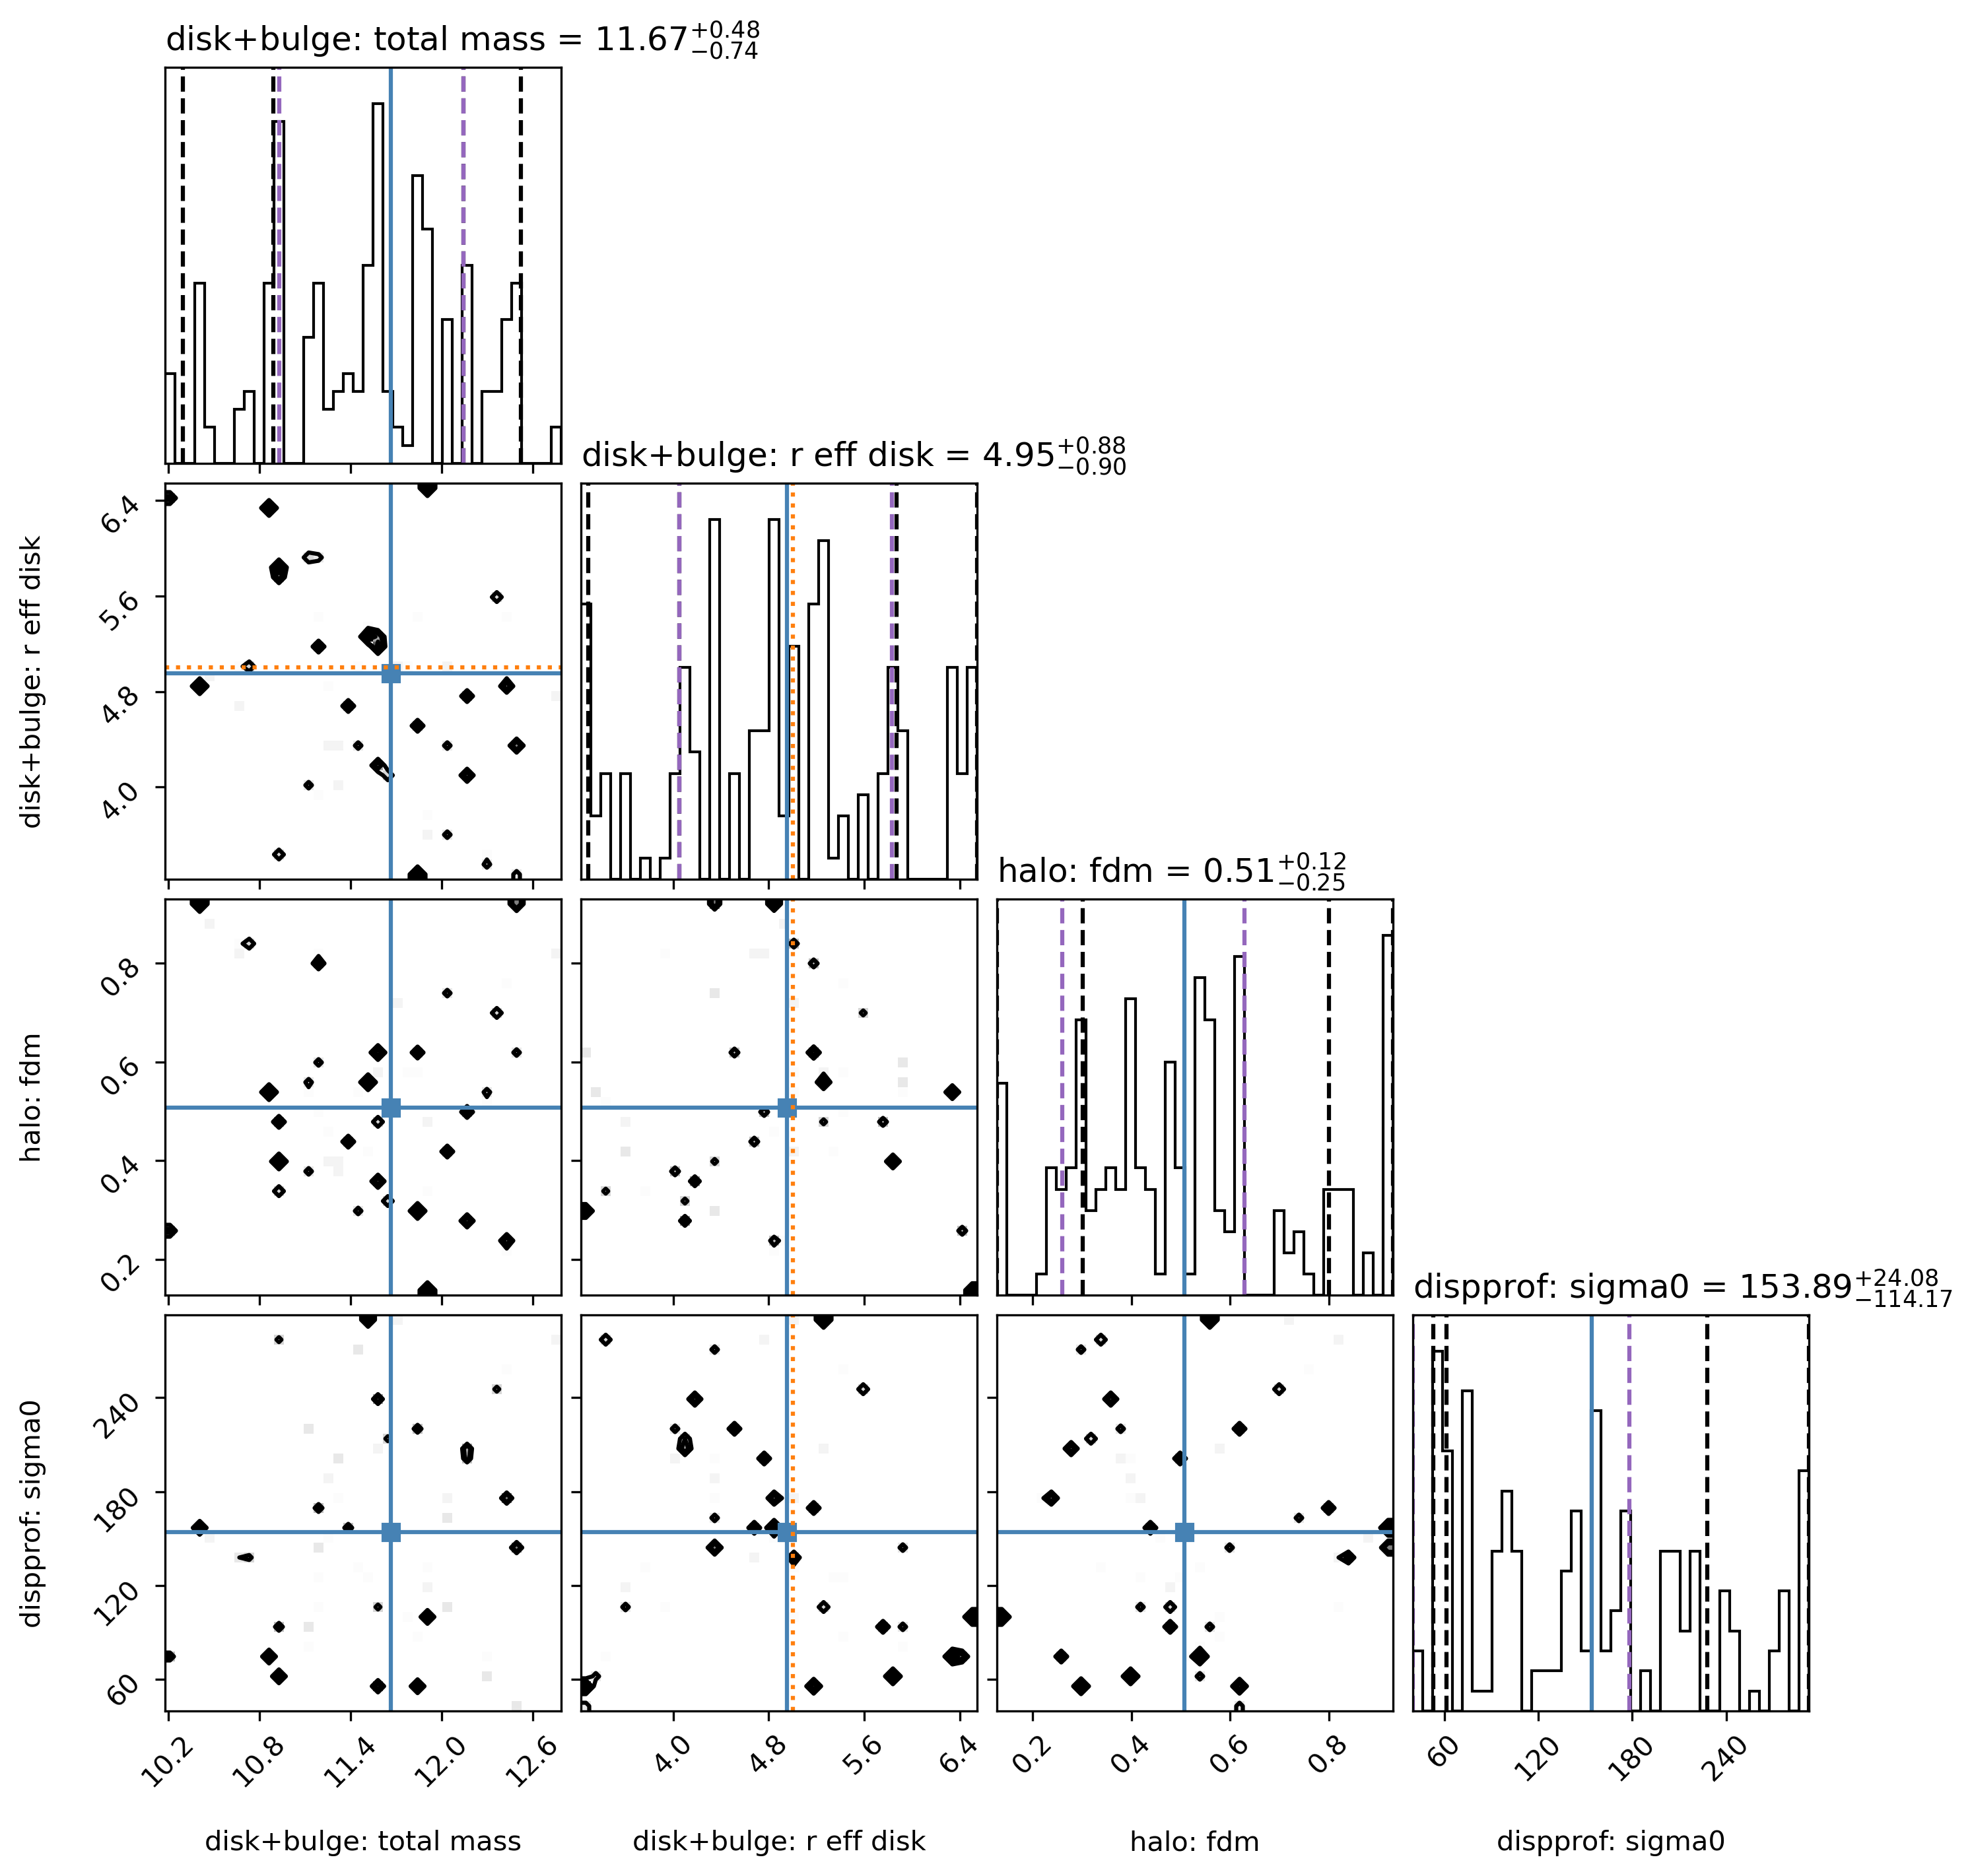
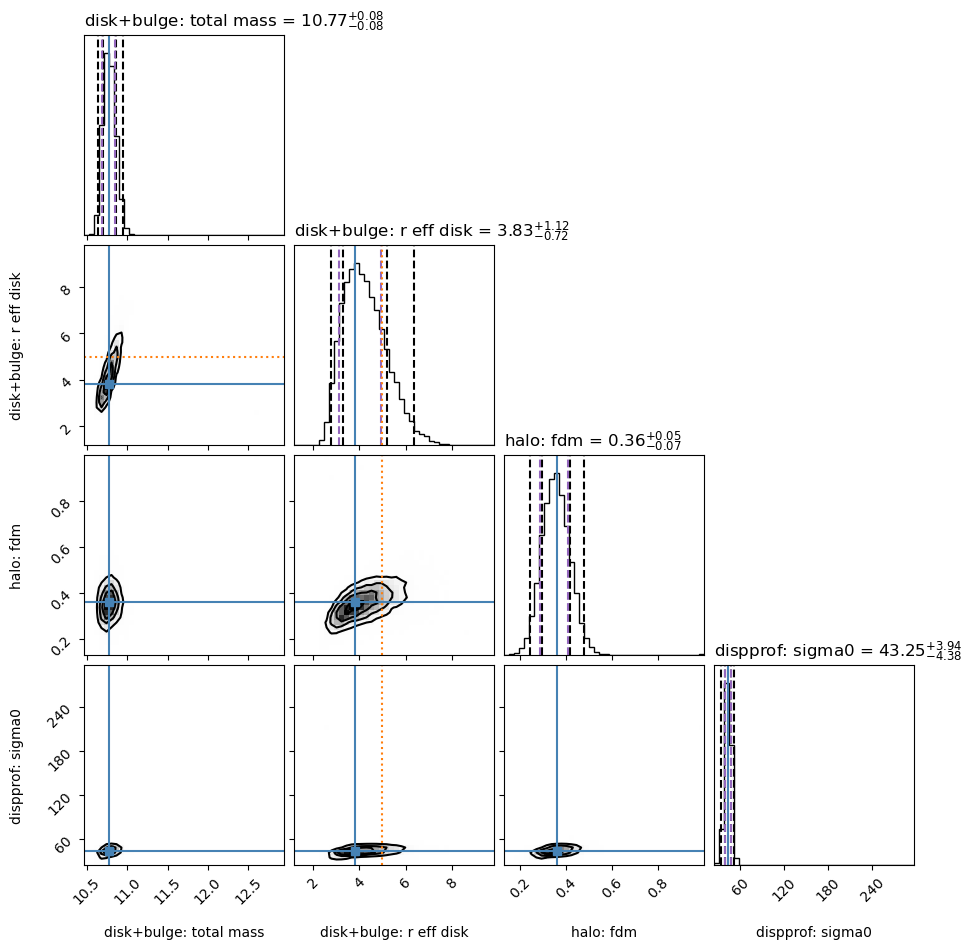
Sampler “corner” plot
The “best-fit” MAP (by default taken to be the peak of each marginalized parameter posterior, independent of the other parameters) is marked with the solid blue line.
However, the MAP can also be found by jointly analyzing two or more parameters’ posterior space (see example below).
Check to see that your Gaussian prior centers are marked in orange in the appropriate rows/columns (if any Gaussian priors are used).
The vertical dashed black lines show the 2.275%, 15.865%, 84.135%, 97.725% percentile intervals for the marginalized posterior for each parameter.
The vertical dashed purple lines show the shortest \(1\sigma\) interval, determined from the marginalized posterior for each parameter independently.
# Look at corner:
filepath = outdir_mcmc+"GS4_43501_mcmc_param_corner.{}".format(plot_type)
Image(filepath, height=620)
5) Visualize a real MCMC example
In the interest of time (for the documentation tutorial), let’s look at some results calculated previously, using 1000 walkers, 50 burn-in steps, and 200 steps.
Using 190 threads, it took about 23 minutes to run the MCMC fit.
First, you need to download the sampler from:
https://www.mpe.mpg.de/resources/IR/DYSMALPY/dysmalpy_optional_extra_files/JUPYTER_OUTPUT_1D.tar.gz
Decompress it in your preferred path (e.g.: /path/to/your/directory) and then set an environment variable to access that directory from this notebook. You can do that from the terminal running:
export DATADIR=/path/to/your/directory
Or, you can simply run the bash command from within the notebook as:
# A working example using the path of one of the maintainers:
%env FULL_MCMC_RUNS_DATADIR=/Users/jespejo/Dropbox/dysmalpy_example_files/JUPYTER_OUTPUT_1D/
env: FULL_MCMC_RUNS_DATADIR=/Users/jespejo/Dropbox/dysmalpy_example_files/JUPYTER_OUTPUT_1D/
# Now, add the environment variable to retrieve the data
_full_mcmc_runs = os.getenv('FULL_MCMC_RUNS_DATADIR')
outdir_mcmc_full = _full_mcmc_runs + 'MCMC_full_run_nw1000_ns200_a5/'
Examine results:
Helpful for:
replotting
reanalyzing chain (e.g, jointly constraining some posteriors)
Reload the galaxy, results files:
f_galmodel =      outdir_mcmc_full + 'galaxy_model.pickle'
f_mcmc_results =  outdir_mcmc_full + 'mcmc_results.pickle'

#----------------------------------------
## Fix module import
import sys
from dysmalpy import fitting_wrappers
sys.modules['fitting_wrappers'] = fitting_wrappers
#----------------------------------------

if os.path.isfile(f_galmodel) & os.path.isfile(f_mcmc_results):
    gal_full, mcmc_results = fitting.reload_all_fitting(filename_galmodel=f_galmodel,
                                filename_results=f_mcmc_results, fit_method='mcmc')
else:
    gal_full = mcmc_results = None
If necessary, also reload the sampler chain:
f_sampler =  outdir_mcmc_full + 'mcmc_sampler.{}'.format(ftype_sampler)
if os.path.isfile(f_sampler) & (mcmc_results is not None):
    mcmc_results.reload_sampler_results(filename=f_sampler)
Plot the best-fit results:
if (gal_full is not None) & (mcmc_results is not None):
    mcmc_results.plot_results(gal_full)
Note:
The burn-in stage for this run is probably a bit too short,
as the trace for r_eff_disk drifts a bit initially.
So it might have been better to use 100 burn steps (50 were used here).
Results report:
# Print report
if (gal_full is not None) & (mcmc_results is not None):
    print(mcmc_results.results_report(gal=gal_full))
###############################
 Fitting for GS4_43501

Date: 2024-05-02 10:49:33.001827

    obs: OBS
         Datafiles:
             vel :  /afs/mpe.mpg.de/home/sedona/dysmalpy_example_data/GS4_43501.obs_prof.txt
         apertures:        CircApertures
         fit_velocity:           True
         fit_dispersion:         True
         fit_flux:               False
         moment:           False
         partial_weight:        True
         n_wholepix_z_min:      3
         oversample:            1
         oversize:              1


Fitting method: MCMC

pressure_support:      True
pressure_support_type: 1

###############################
 Fitting results
-----------
 disk+bulge
    total_mass         10.7707  -   0.0797 +   0.0770
    r_eff_disk          3.8296  -   0.7181 +   1.1167

    n_disk              1.0000  [FIXED]
    r_eff_bulge         1.0000  [FIXED]
    n_bulge             4.0000  [FIXED]
    bt                  0.3000  [FIXED]

    noord_flat          True
-----------
 halo
    fdm                 0.3593  -   0.0730 +   0.0473

    mvirial            12.5670  [TIED]
    conc                5.0000  [FIXED]
-----------
 dispprof
    sigma0             43.2500  -   4.3789 +   3.9371
-----------
 zheightgaus
    sigmaz              0.6505  [TIED]
-----------
 geom
    inc                62.0000  [FIXED]
    pa                142.0000  [FIXED]
    xshift              0.0000  [FIXED]
    yshift              0.0000  [FIXED]
    vel_shift           0.0000  [FIXED]

-----------
    mvirial            12.5670  -   0.3169 +   0.0126

-----------
Adiabatic contraction: False

-----------
Red. chisq: 2.4225
Or save results report to file:
# Save report to file:
f_mcmc_report = outdir_mcmc + 'mcmc_fit_report.txt'
if (gal_full is not None) & (mcmc_results is not None):
    mcmc_results.results_report(gal=gal_full, filename=f_mcmc_report)
Optional: Reanalyze sampler for MAP using joint posterior spaces for some parameters
# Look at joint posterior of 4 parameters simultaneously:
#       total baryonic mass, r_eff_disk, fDM, sigma0

# Create a list / an array containing each parameter to include:
linked_post_arr = []
# For each parameter, include a length 2 list / array
#     with the component name and parameter name:
linked_post_arr.append(['disk+bulge', 'total_mass'])
linked_post_arr.append(['disk+bulge', 'r_eff_disk'])
linked_post_arr.append(['halo', 'fdm'])
linked_post_arr.append(['dispprof', 'sigma0'])


# Only consider 1 bundle of joint posteriors:
linked_posterior_names = [ linked_post_arr ]
# Then rerun the posterior distribution analysis, using this linked posterior set:
if (gal_full is not None) & (mcmc_results is not None):
    mcmc_results.linked_posterior_names = linked_posterior_names

    mcmc_results.analyze_posterior_dist(gal=gal_full)
# Update theta to best-fit:
if (gal_full is not None) & (mcmc_results is not None):
    gal_full.model.update_parameters(mcmc_results.bestfit_parameters)
# Recalculate the bestfit chisq / redchisq:
if (gal_full is not None) & (mcmc_results is not None):
    gal_full.create_model_data()

    mcmc_results.bestfit_redchisq = fitting.chisq_red(gal_full)
    mcmc_results.bestfit_chisq = fitting.chisq_eval(gal_full)
Result report for this re-analysis:
# Print report
if (gal_full is not None) & (mcmc_results is not None):
    print(mcmc_results.results_report(gal=gal_full))
###############################
 Fitting for GS4_43501

Date: 2024-05-02 10:49:35.371715

    obs: OBS
         Datafiles:
             vel :  /afs/mpe.mpg.de/home/sedona/dysmalpy_example_data/GS4_43501.obs_prof.txt
         apertures:        CircApertures
         fit_velocity:           True
         fit_dispersion:         True
         fit_flux:               False
         moment:           False
         partial_weight:        True
         n_wholepix_z_min:      3
         oversample:            1
         oversize:              1


Fitting method: MCMC

pressure_support:      True
pressure_support_type: 1

###############################
 Fitting results
-----------
 disk+bulge
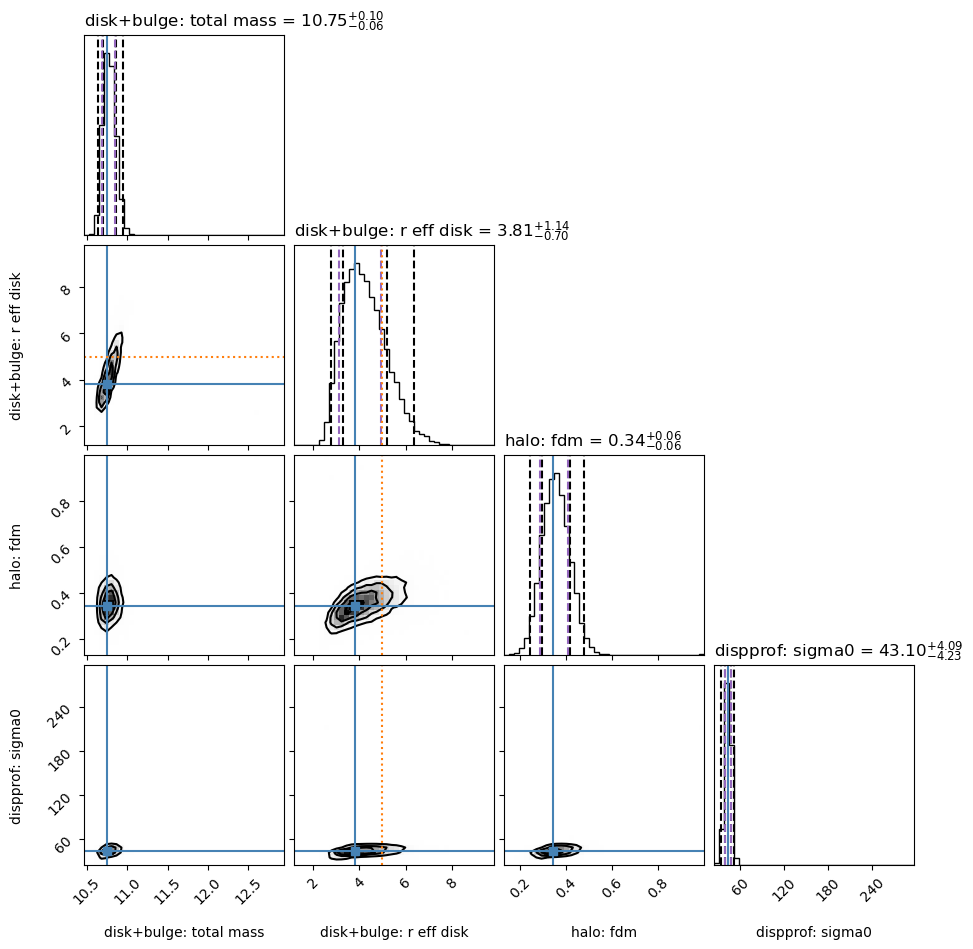
    total_mass         10.7489  -   0.0578 +   0.0989
    r_eff_disk          3.8097  -   0.6982 +   1.1366

    n_disk              1.0000  [FIXED]
    r_eff_bulge         1.0000  [FIXED]
    n_bulge             4.0000  [FIXED]
    bt                  0.3000  [FIXED]

    noord_flat          True
-----------
 halo
    fdm                 0.3429  -   0.0566 +   0.0638

    mvirial            12.4463  [TIED]
    conc                5.0000  [FIXED]
-----------
 dispprof
    sigma0             43.1000  -   4.2289 +   4.0871
-----------
 zheightgaus
    sigmaz              0.6471  [TIED]
-----------
 geom
    inc                62.0000  [FIXED]
    pa                142.0000  [FIXED]
    xshift              0.0000  [FIXED]
    yshift              0.0000  [FIXED]
    vel_shift           0.0000  [FIXED]

-----------
    mvirial            12.5670  -   0.3169 +   0.0126

-----------
Adiabatic contraction: False

-----------
Red. chisq: 1.9576
Best-fit results plot for this reanalysis:
if (gal_full is not None) & (mcmc_results is not None):
    mcmc_results.plot_bestfit(gal_full)

Posterior distribution showing this new joint-posterior MAP:
if (gal_full is not None) & (mcmc_results is not None):
    mcmc_results.plot_corner(gal_full)
6) Nested Sampling Fitting
Using the dynesty nested sampler
Get a clean copy of model
gal.model = copy.deepcopy(mod_set)
Set up NestedFitter fitter with fitting parameters
# Options passed to Dynesty
## SHORT TEST:
sample = 'rwalk'
maxiter = 200
nlive_init = 50
nlive_batch = 50
nCPUs = 4

blob_name = 'mvirial'    # Also save 'blob' values of Mvirial, calculated at every chain step


fitter = fitting.NestedFitter(sample=sample, maxiter=maxiter,
                               nlive_init=nlive_init, nlive_batch=nlive_batch,
                               nCPUs=nCPUs, blob_name=blob_name)
Set up fit/plot output options
# Output directory
outdir_dynesty = outdir + 'Dynesty/'

# Output options:
do_plotting = True
plot_type = 'png'
overwrite = True

output_options = config.OutputOptions(outdir=outdir_dynesty,
                                      do_plotting=do_plotting,
                                      plot_type=plot_type,
                                      overwrite=overwrite)
Run Dysmalpy fitting: Nested Sampling
dynesty_results = fitter.fit(gal, output_options)
0it [00:00, ?it/s]
251it [00:53, 4.68it/s, batch: 0 | bound: 4 | nc: 1 | ncall: 2414 | eff(%): 10.398 | loglstar: -inf < -50.975 < inf | logz: -58.535 +/- 0.336 | dlogz: 0.532 > 0.010]
Examine Nested sampling results
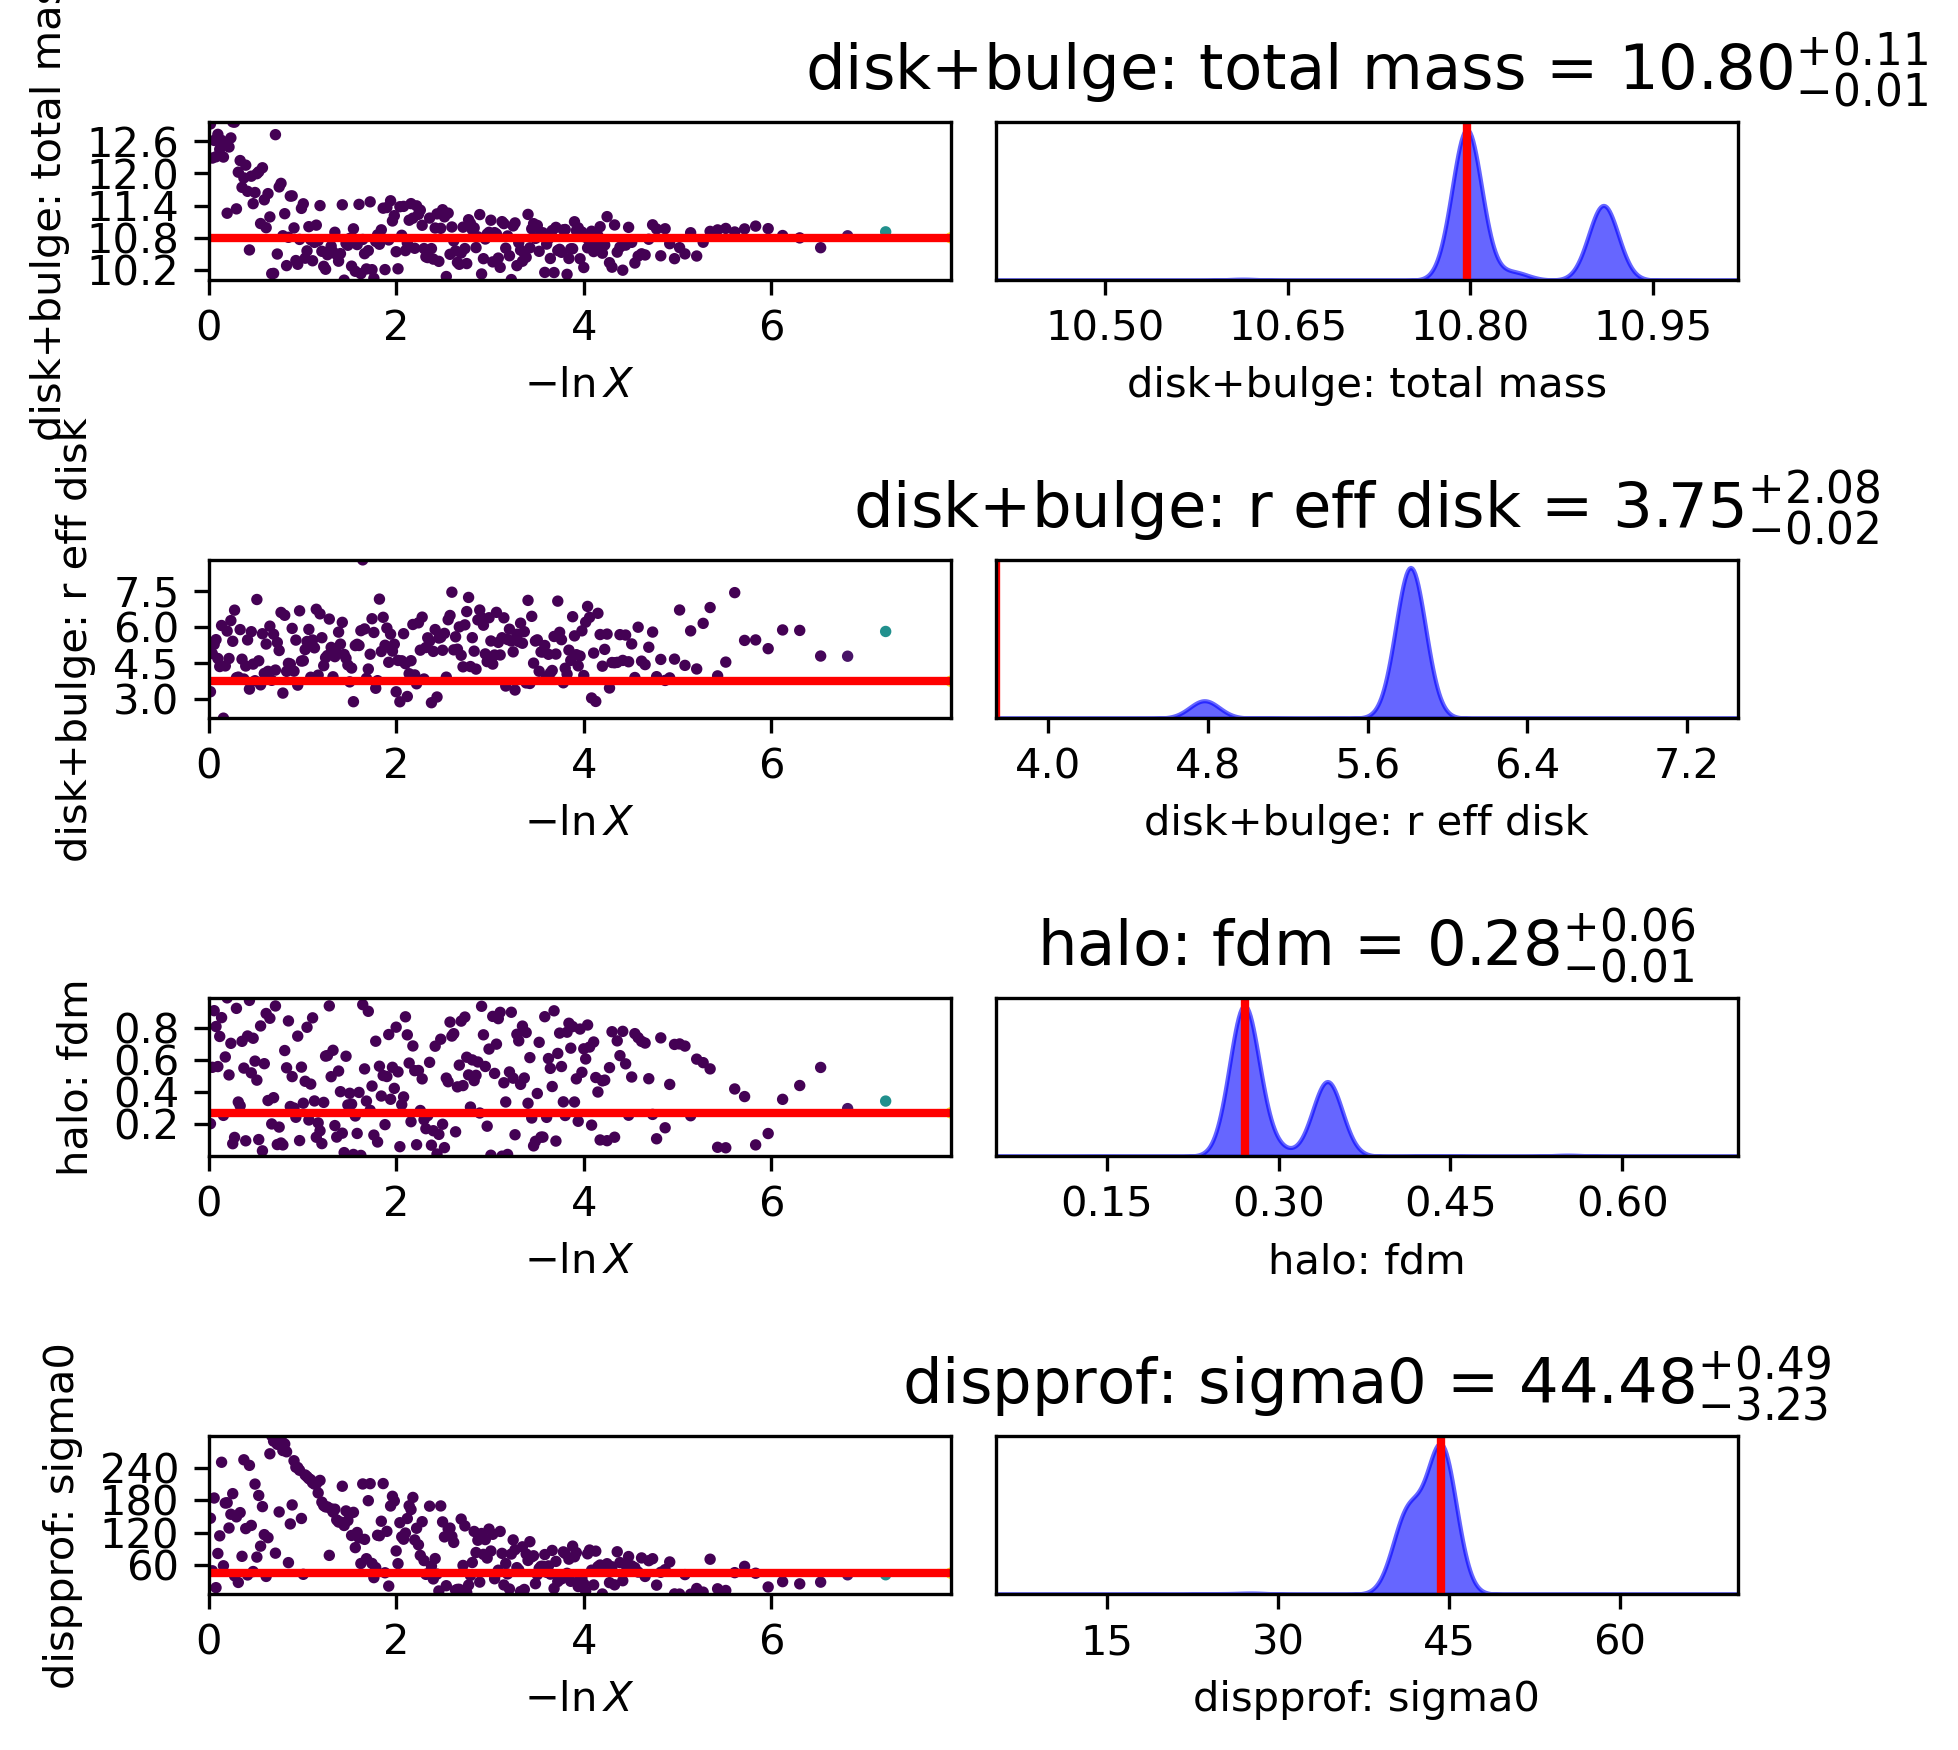
As with MCMC, this (very short!) example looks terrible, but it’s instructive to see what’s happening even if you only did a very short Dynesty test:
Trace
The individual walkers should move around in the parameter space over the chain iterations (not necessarily for every step; but there should be some exploration of the space)
# Look at trace:
filepath = outdir_dynesty+"GS4_43501_nested_trace.{}".format(plot_type)
Image(filepath, width=600)
Best-fit
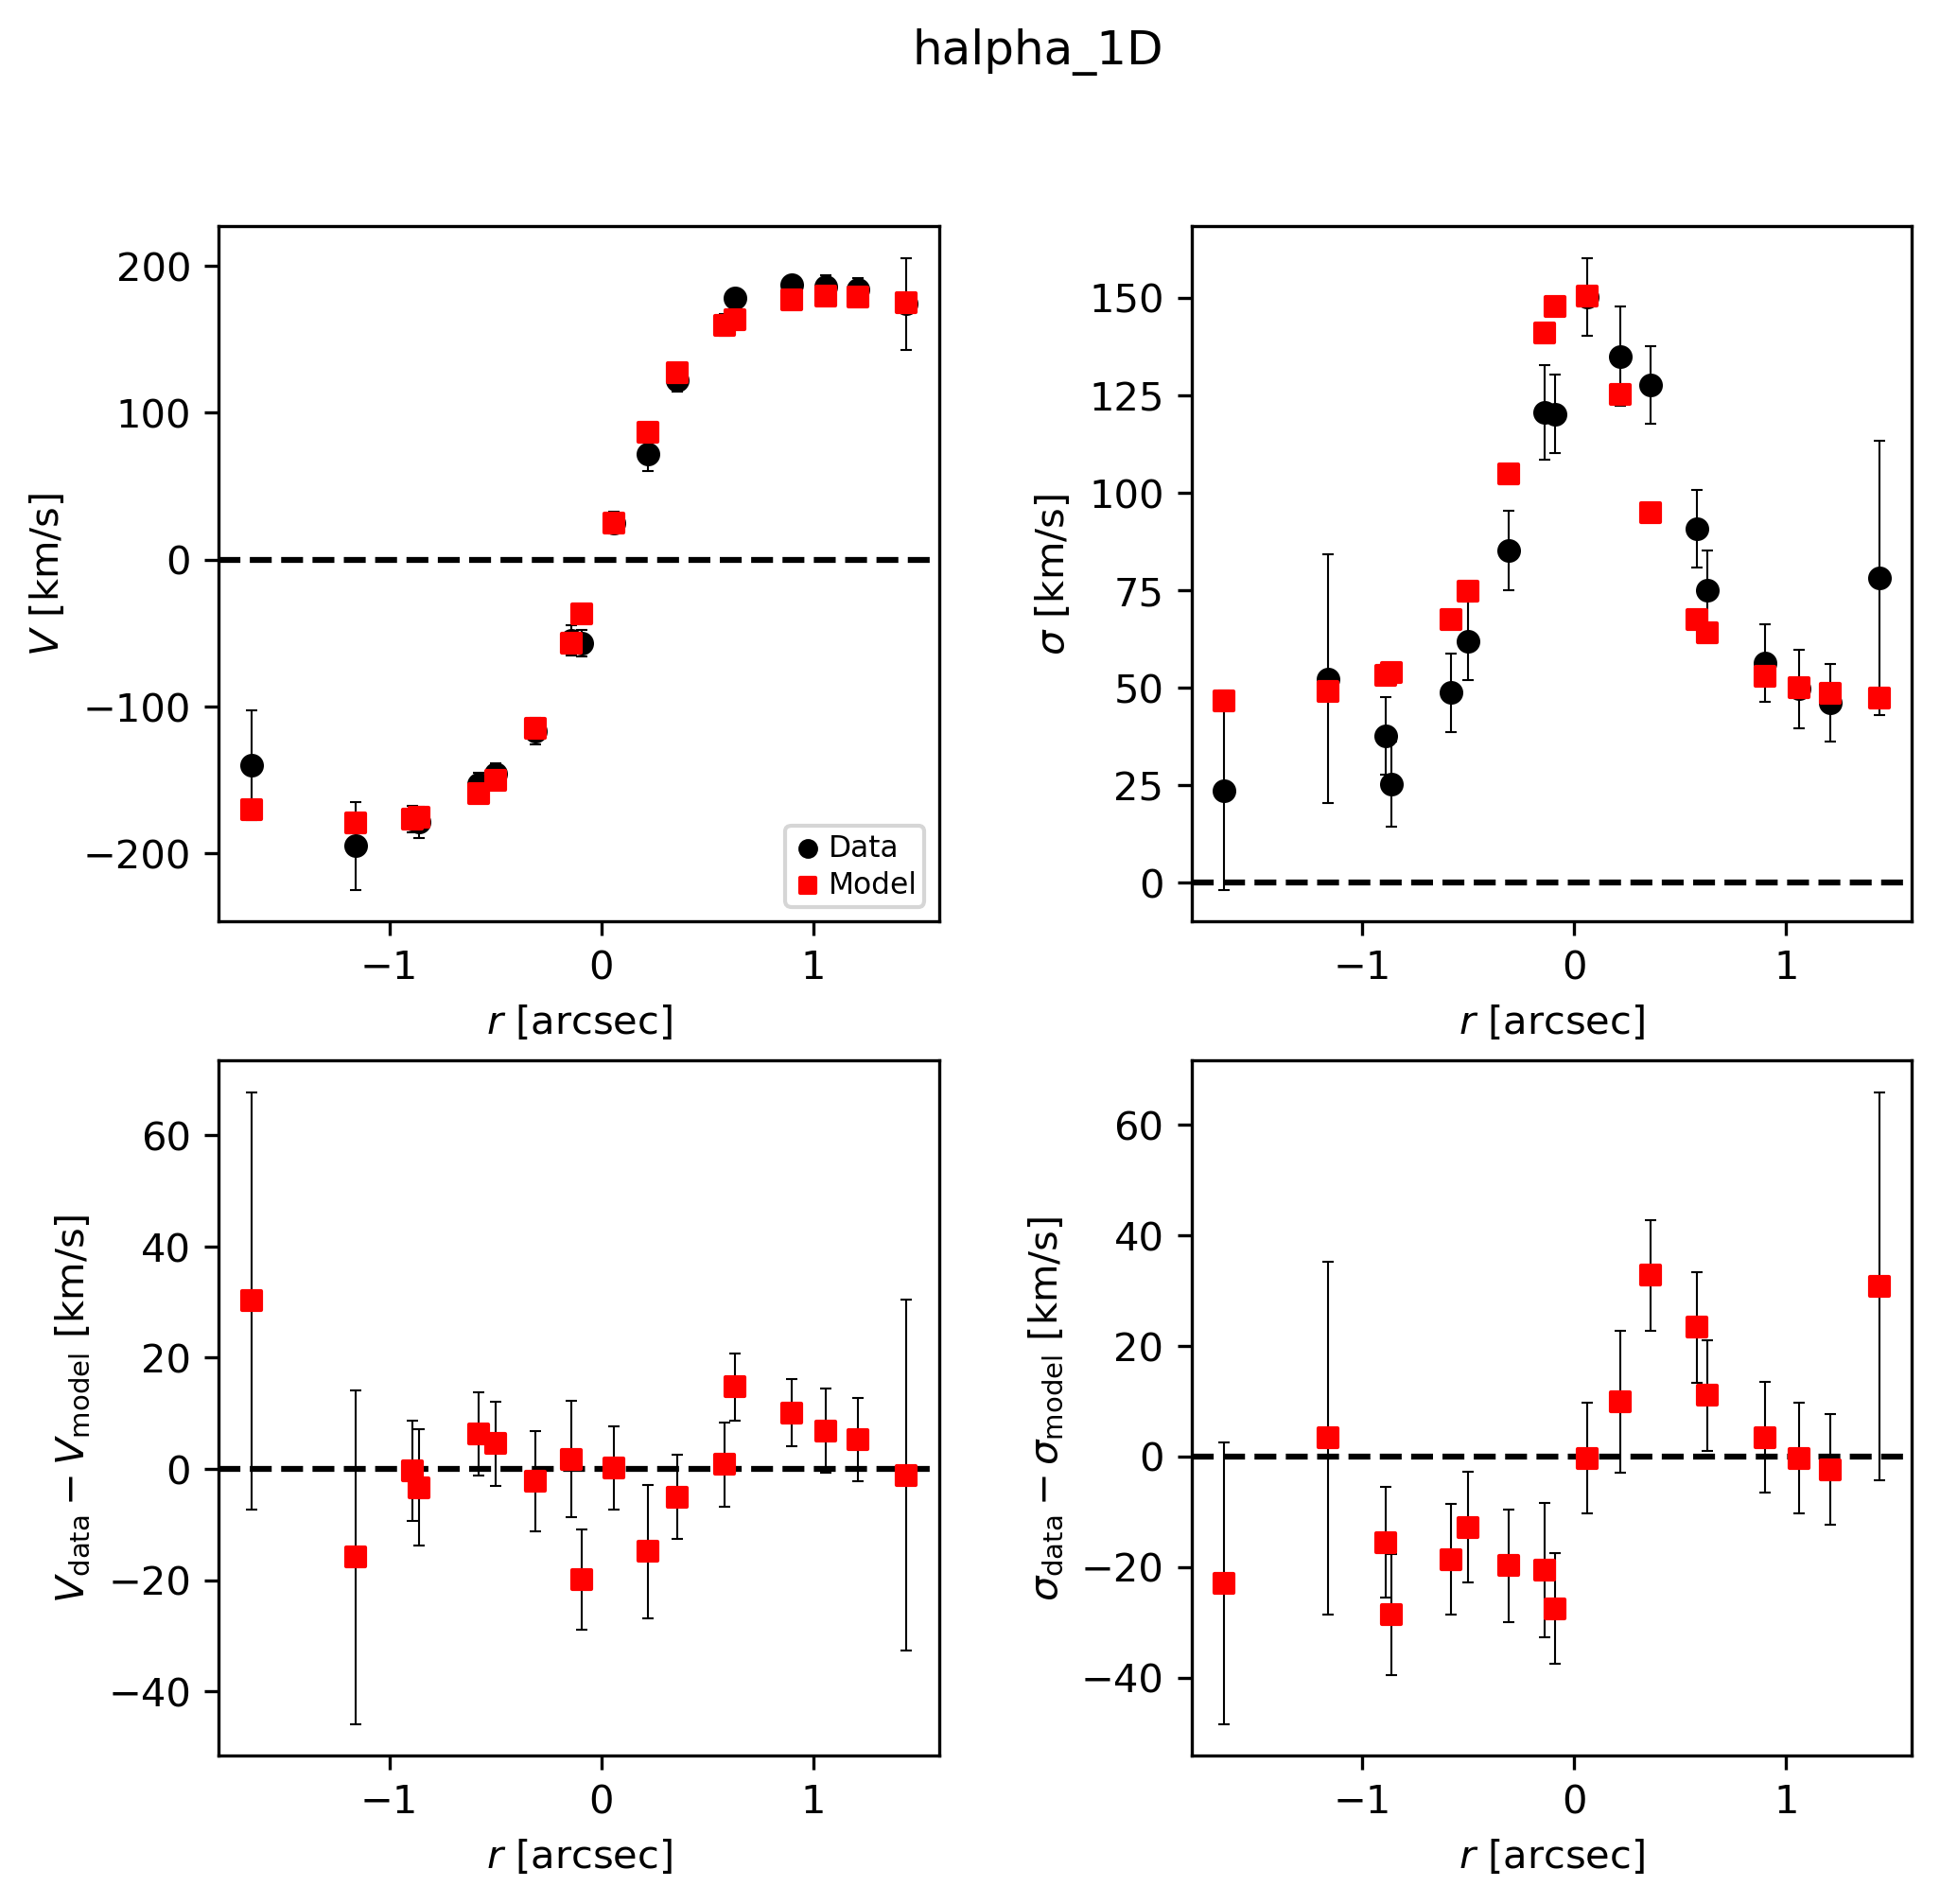
This is a good opportunity to check that the model PA and slit PA are correct, or else the data and model curves will have opposite shapes!
# Look at best-fit:
filepath = outdir_dynesty+"GS4_43501_nested_bestfit_halpha_1D.{}".format(plot_type)
Image(filepath, width=600)
Sampler “corner” plot
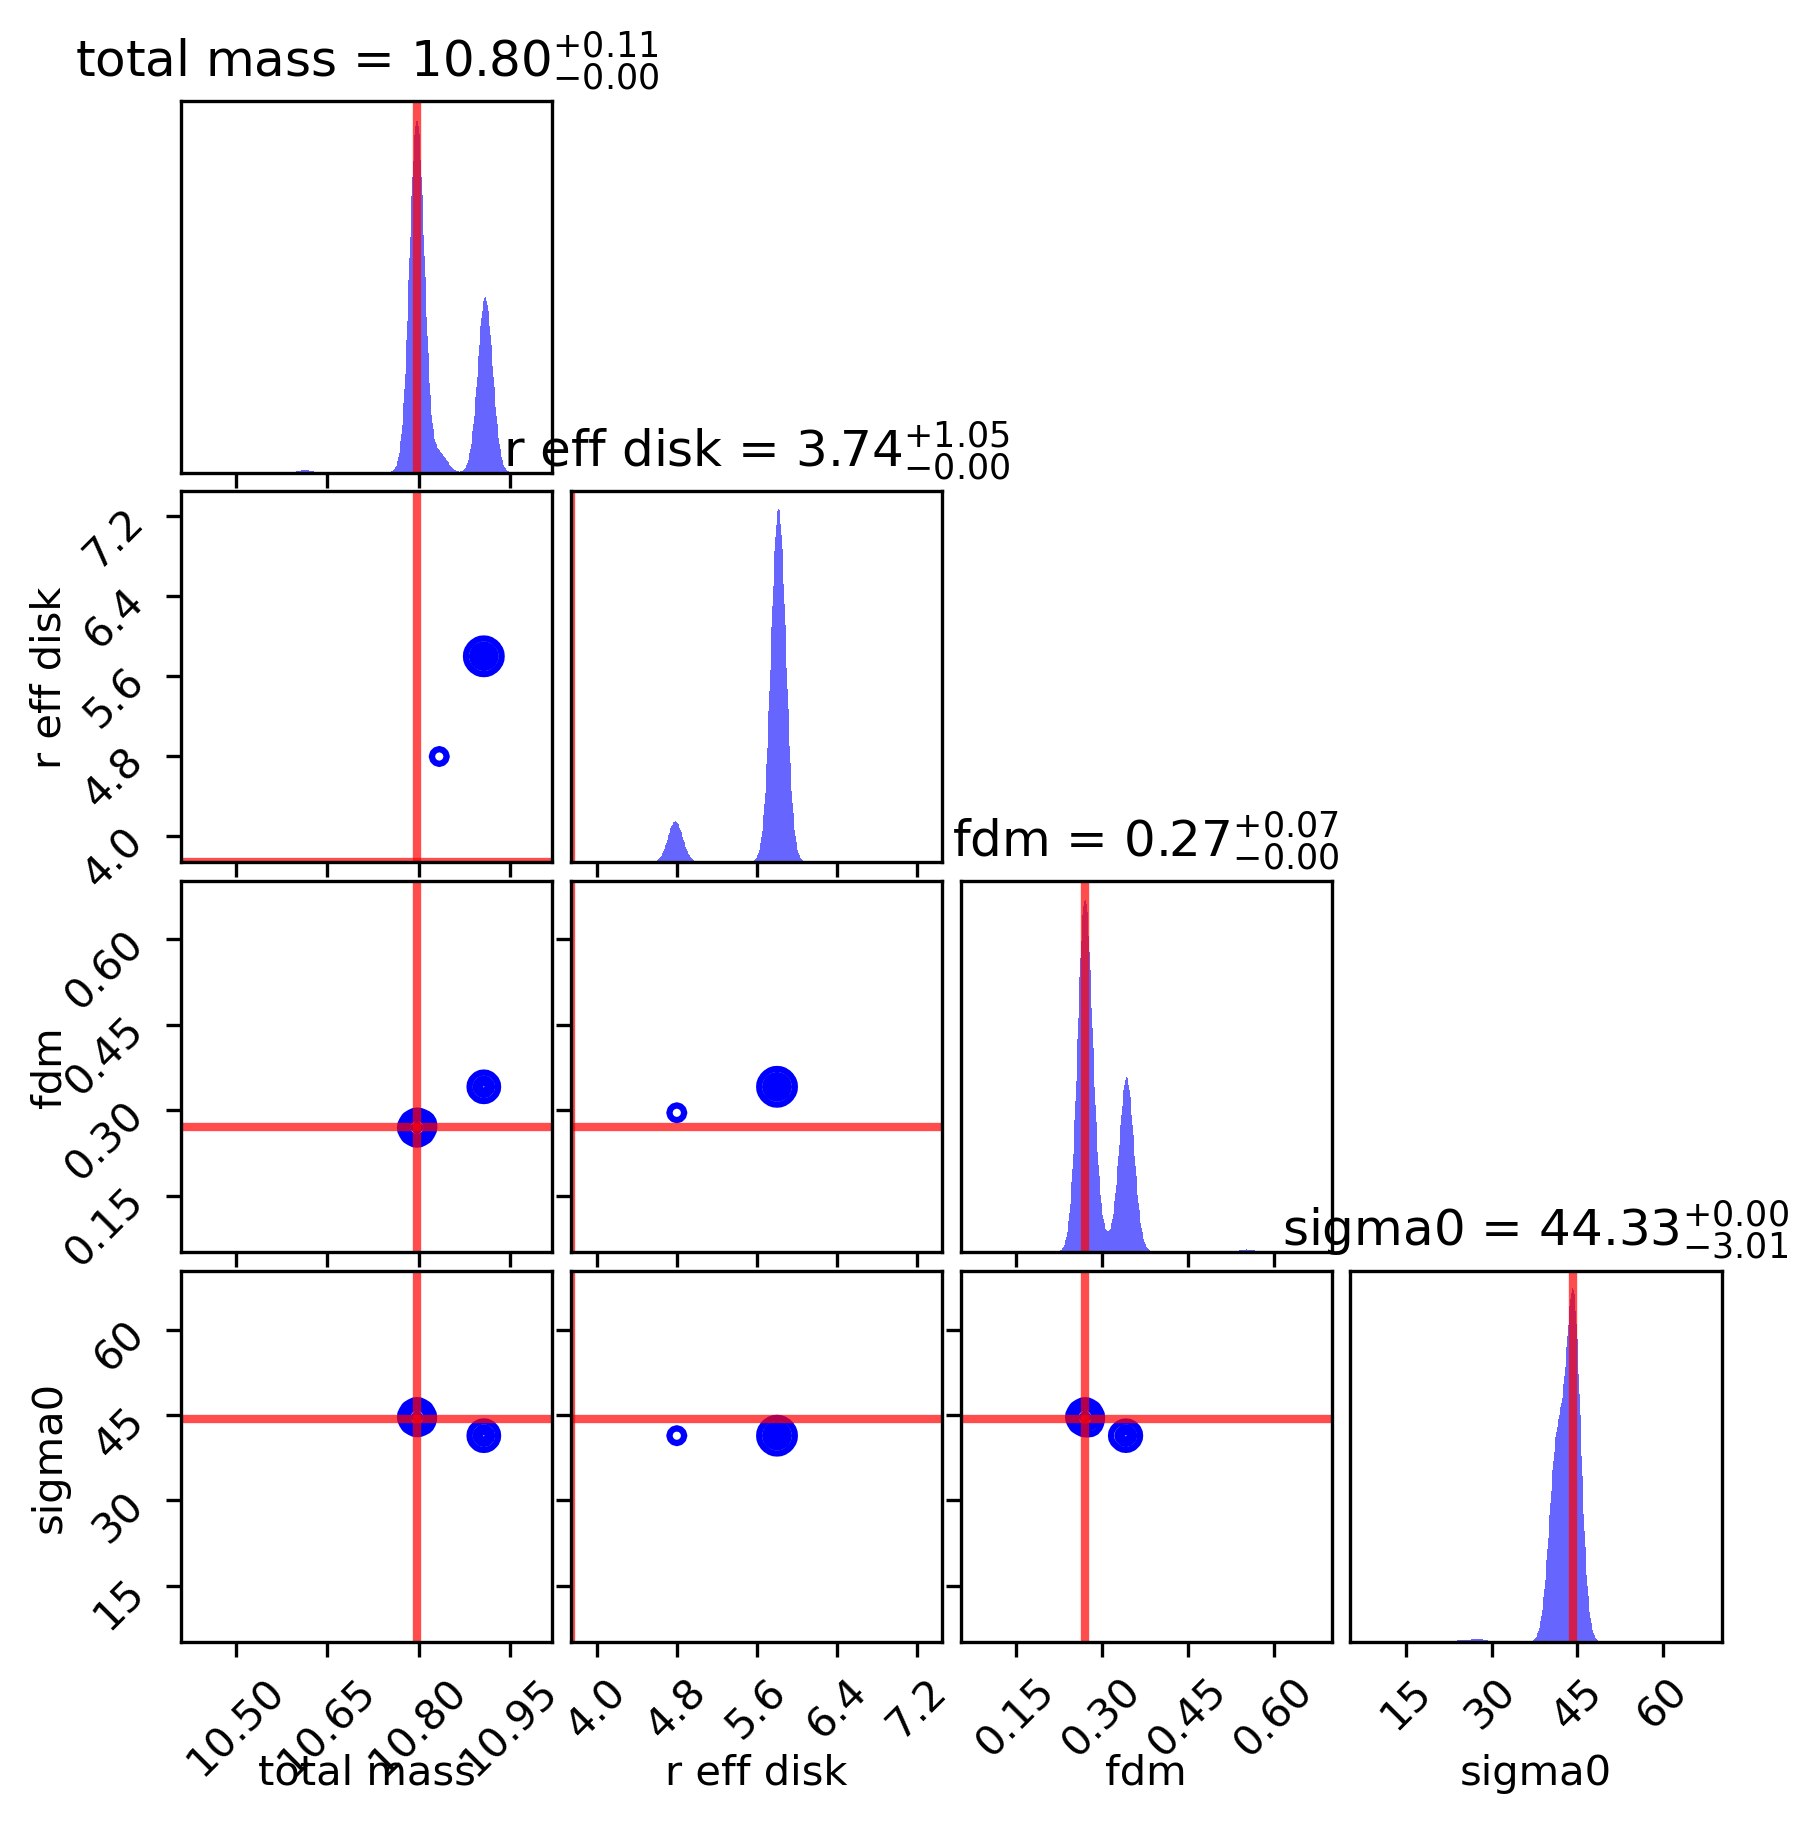
The “best-fit” MAP (by default taken to be the peak of each marginalized parameter posterior, independent of the other parameters) is marked with the solid blue line.
However, the MAP can also be found by jointly analyzing two or more parameters’ posterior space (see example below).
Check to see that your Gaussian prior centers are marked in orange in the appropriate rows/columns (if any Gaussian priors are used).
The vertical dashed black lines show the 2.275%, 15.865%, 84.135%, 97.725% percentile intervals for the marginalized posterior for each parameter.
The vertical dashed purple lines show the shortest \(1\sigma\) interval, determined from the marginalized posterior for each parameter independently.
# Look at corner:
filepath = outdir_dynesty+"GS4_43501_nested_param_corner.{}".format(plot_type)
Image(filepath, height=620)
7) Visualize a real Nested Sampling example
In the interest of time, let’s look at some results calculated previously.
For this fit, we used nlive_init = 1000, nlive_batch = 1000, the rwalk sampling and multi bounding, and the stopping criterion with pfrac = 1 (eg, no maximum number of iterations).
Using 8 threads, it took about 90 minutes to run the Dynesty fit.
outdir_dynesty_full = outdir + 'Dynesty_full_run_maxiterNone_nliveinit1000_nlivebatch1000/'
Examine results:
Helpful for:
replotting
reanalyzing chain (eg, jointly constraining some posteriors)
…
Reload the galaxy, results files:
f_galmodel =      outdir_dynesty_full + 'GS4_43501_model.pickle'
f_dynesty_results =  outdir_dynesty_full + 'GS4_43501_nested_results.pickle'

if os.path.isfile(f_galmodel) & os.path.isfile(f_dynesty_results):
    gal_full, dynesty_results = fitting.reload_all_fitting(filename_galmodel=f_galmodel,
                                filename_results=f_dynesty_results, fit_method='nested')
else:
    gal_full = dynesty_results = None
If necessary, also reload the sampler chain:
f_sampler =  outdir_dynesty_full + 'GS4_43501_nested_sampler_results.{}'.format(ftype_sampler)
if os.path.isfile(f_sampler) & (dynesty_results is not None):
    dynesty_results.reload_sampler_results(filename=f_sampler)
Plot the best-fit results:
if (gal_full is not None) & (dynesty_results is not None):
    dynesty_results.plot_results(gal_full)
Results report:
# Print report
if (gal_full is not None) & (dynesty_results is not None):
    print(dynesty_results.results_report(gal=gal_full))
Or save results report to file:
# Save report to file:
f_dynesty_report = outdir_dynesty + 'dynesty_fit_report.txt'
if (gal_full is not None) & (dynesty_results is not None):
    dynesty_results.results_report(gal=gal_full, filename=f_dynesty_report)
Optional: Reanalyze sampler for MAP using joint posterior spaces for some parameters
# Look at joint posterior of 4 parameters simultaneously:
#       total baryonic mass, r_eff_disk, fDM, sigma0

# Create a list / an array containing each parameter to include:
linked_post_arr = []
# For each parameter, include a length 2 list / array
#     with the component name and parameter name:
linked_post_arr.append(['disk+bulge', 'total_mass'])
linked_post_arr.append(['disk+bulge', 'r_eff_disk'])
linked_post_arr.append(['halo', 'fdm'])
linked_post_arr.append(['dispprof', 'sigma0'])


# Only consider 1 bundle of joint posteriors:
linked_posterior_names = [ linked_post_arr ]
# Then rerun the posterior distribution analysis, using this linked posterior set:
if (gal_full is not None) & (dynesty_results is not None):
    dynesty_results.linked_posterior_names = linked_posterior_names

    dynesty_results.analyze_posterior_dist(gal=gal_full)
# Update theta to best-fit:
if (gal_full is not None) & (dynesty_results is not None):
    gal_full.model.update_parameters(dynesty_results.bestfit_parameters)
# Recalculate the bestfit chisq / redchisq:
if (gal_full is not None) & (dynesty_results is not None):
    gal_full.create_model_data()

    dynesty_results.bestfit_redchisq = fitting.chisq_red(gal_full)
    dynesty_results.bestfit_chisq = fitting.chisq_eval(gal_full)
Result report for this re-analysis:
# Print report
if (gal_full is not None) & (dynesty_results is not None):
    print(dynesty_results.results_report(gal=gal_full))
Best-fit results plot for this reanalysis:
if (gal_full is not None) & (dynesty_results is not None):
    dynesty_results.plot_bestfit(gal_full)
Posterior distribution showing this new joint-posterior MAP:
if (gal_full is not None) & (dynesty_results is not None):
    dynesty_results.plot_corner(gal_full)