eROSITA Cosmology Presskit
Here you can find images and graphics for download for the cosmology results from the first eROSITA sky-survey data release.
You are free to use the visuals for your own eROSITA reporting, please give the appropriate credit with each visual.
 plotted on the eROSITA map of the half-sky (in the 0.3-2.3 keV energy band, Azimuthal Equal Area projection). The colours indicate the redshift (distance) of the clusters, ranging from 0 to 1.3 (up to about 9 billion years look-back time), and the size of the circles indicate the apparent X-ray brightness of the source.")
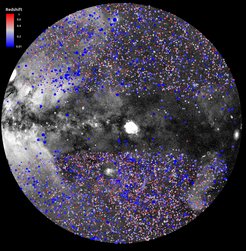
This image shows the eROSITA catalogue of clusters of galaxies (from the first Data Release) plotted on the eROSITA map of the half-sky (in the 0.3-2.3 keV energy band, Azimuthal Equal Area projection). The colours indicate the redshift (distance) of the clusters, ranging from 0 to 1.3 (up to about 9 billion years look-back time), and the size of the circles indicate the apparent X-ray brightness of the source.
© MPE, J. Sanders for the eROSITA consortium
 in blue, from weak lensing (DES+KiDS) in grey, and from cluster number counts (SPT) in black.")
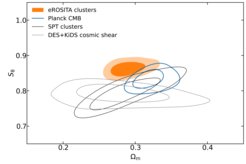
This plot shows the constraints put on the total matter density in the universe and the S8 parameter. Constraints from eROSITA galaxy clusters are in orange, constraints from the Cosmic Microwave Background (Planck) in blue, from weak lensing (DES+KiDS) in grey, and from cluster number counts (SPT) in black.
© MPE, V. Ghirardini for the eROSITA consortium
. The optical images are taken from the Legacy Surveys (g-r-z filterbands) with back- and foreground objects removed. Overlayed in blue are the eROSITA X-ray images showing the hot intracluster medium. The redshifts 0.1, 0.4, 0.9, and 1.3 correspond to look-back times of 1.3, 4.3, 7.4 and 9 billion years look-back time.")
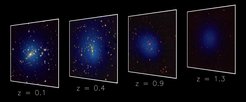
Examples of four eROSITA galaxy clusters are shown at different redshifts (distances). The optical images are taken from the Legacy Surveys (g-r-z filterbands) with back- and foreground objects removed. Overlayed in blue are the eROSITA X-ray images showing the hot intracluster medium. The redshifts 0.1, 0.4, 0.9, and 1.3 correspond to look-back times of 1.3, 4.3, 7.4 and 9 billion years look-back time.
©MPE, M. Kluge and C. Garrel for the eROSITA consortium
A tour of galaxy clusters in eROSITA
This video shows both the full eROSITA cluster catalogue (see figure above) and a zoom to some well-known clusters, including the nearby Virgo cluster, the large overdense region of clusters known as the Shapley supercluster, the Centaurus cluster, the A3391/95 interacting cluster system, and finally, the Fornax cluster.
eROSITA clusters in 3D
In this animation, the eROSITA clusters are shown in 3 dimensions in a spherical coordinate system, where Galactic latitude and longitude and redshift are shown. Each dot is a cluster, with the colours indicating the redshift (see first figure).